Share the statistic on social media channels or embed the statistic in your website using "Embed Code", where available.
Share chart
Embed chart Embed copied!Cite this statistic and select one of the following formats: APA, Chicago, Harvard, MLA & Bluebook
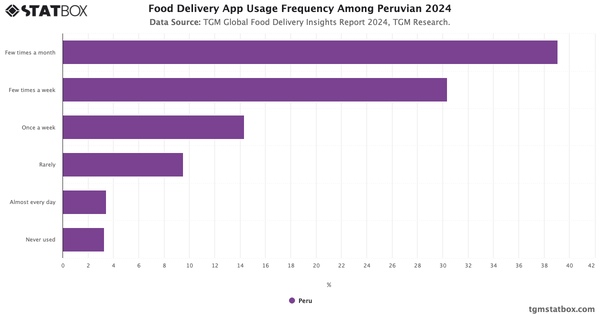
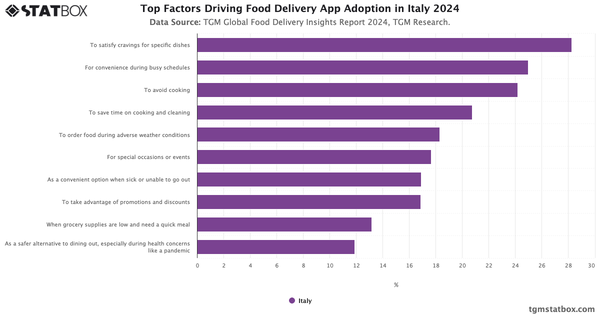
"What are your primary reasons for using food delivery applications?"
Key Takeaways
In Peru, food delivery apps have become a go-to solution for simplifying daily life. While users turn to them for a range of reasons—from satisfying cravings (25.5%) to taking advantage of discounts (26.5%)—the most common motivation is saving time on cooking and cleaning (39.7%). Many also use these services to avoid cooking or when they're sick, busy, or celebrating a special occasion. Although less frequently cited, access to a variety of cuisines or late-night dining also contribute to overall usage, showing how food delivery meets both practical and personal needs.

Food Delivery Insights Report in Peru
Discover all you need to know about Food Delivery in Peru with TGM StatBox. Get the comprehensive report, featuring graphs and tables for insights.
Go to report


Connect with our expert team for immediate assistance or comprehensive market analysis. We are always ready to support your business needs.