Gender-Based Divergence in Christmas 2025 Purchase Priorities
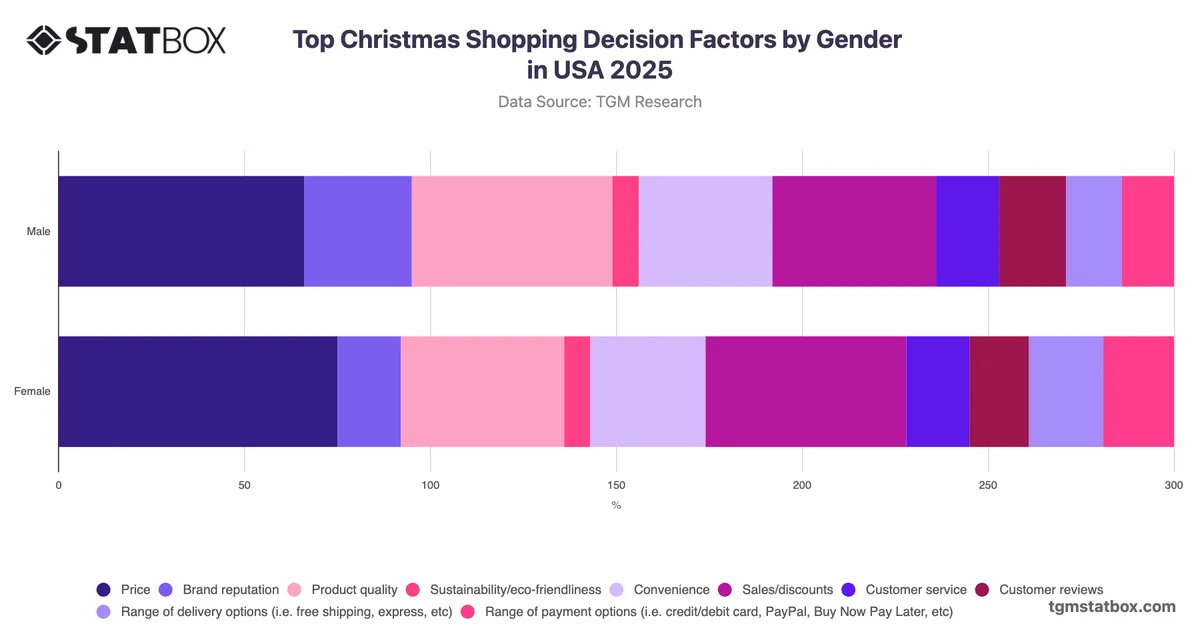
Christmas gift purchasing in the United States spans a broad range of categories, from experiential and consumable items to durable goods and personal luxuries. Gender plays a meaningful role in shaping how consumers allocate their holiday budgets, with category preferences often diverging along lines tied to personal relevance, gifting conventions, and household roles.
The most analytically significant pattern in Christmas 2025 planned purchases is the divergence in category priorities rather than any single dominant item. Clothing ranks highest for both groups, yet the 11-percentage-point gap between women (68%) and men (57%) is modest compared to the contrasts seen elsewhere. Electronics stand out as a male-skewed category at 50% versus 38% among women, while beauty and cosmetics show the sharpest reversal, with women at 37% compared to 16% among men. Men also indicate stronger intent around gift cards, travel experiences, and charitable donations. These contrasts suggest that Christmas campaign messaging calibrated to a single consumer profile risks underperforming across gender segments. Retailers and brands with cross-category portfolios may benefit from testing gender-segmented creative and promotional prioritisation, particularly in electronics and beauty, where the divergence is large enough to warrant distinct communication strategies.