Insights library
Explore a wide range of consumer insights and statistics across industries. Discover charts on behaviors, preferences, attitudes, and market trends to find the data most relevant to your research and decision-making.
 Pro
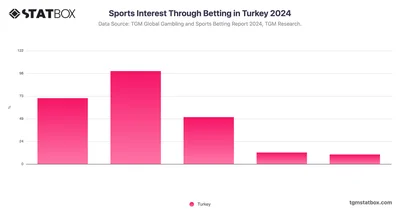
Understand how sports interest is influenced by betting activities in Turkey, with detailed data on sports preferences and betting behaviors.
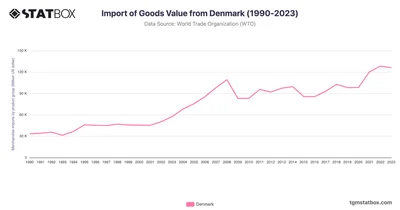
Denmark’s imports rose from $33.3B in 1990 to $128.3B in 2022, showcasing its robust trade-driven economy. Discover more statistics and insights on TGM StatBox.
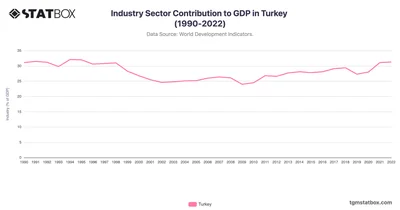
Turkey’s industry sector has shown resilience and growth, with contributions around 31% in the early 1990s and maintaining this level into the 2020s.
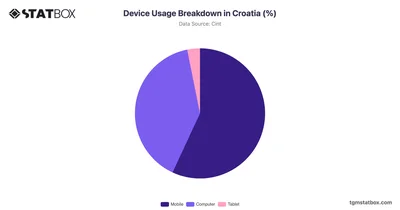
Croatia shows a relatively balanced device usage pattern, with 56.93% opting for mobile devices. Discover more about device usage breakdown in Croatia, on TGM StatBox.
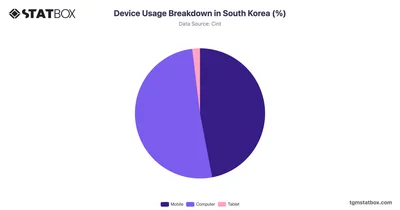
Explore device usage breakdown in South Korea, showcasing percentage distribution of smartphones, tablets, desktops. Analyze the trends shaping digital habits.
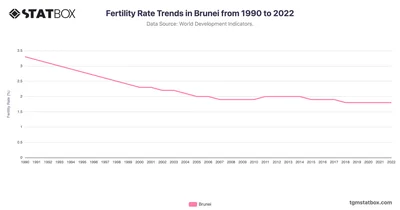
Track fertility trends in Brunei from 1990 to 2022, showcasing demographic changes in a dynamic economy. Discover more statistics and insights on TGM StatBox.
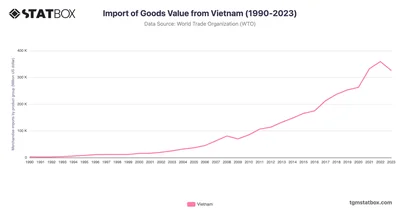
Vietnam’s imports expanded from $2.7B in 1990 to $359.1B in 2022, driven by industrial growth and trade integration. Discover more statistics and insights on TGM StatBox.
 Pro
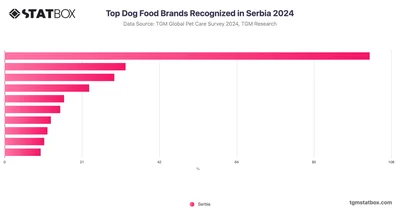
The top three dog food brands recognized by pet owners are Pedigree, Premil, and Royal Canin, with Pedigree leading the pack at 47.2% recognition.
 Pro
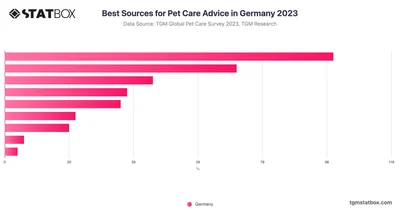
In Germany, veterinarians are the leading source for pet care advice. This trend mirrors global patterns, where professional expertise ensures reliable guidance for pet owners.
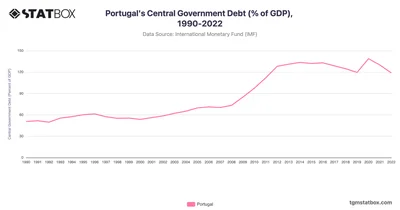
Portugal’s debt peaked at 138.76% in 2020, easing to 118.77% by 2022 amid fiscal reforms. Find more statistics and insights on TGM StatBox.
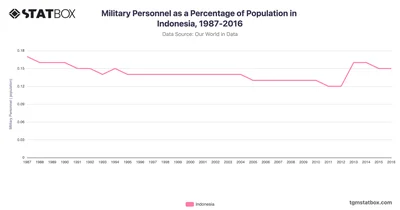
Indonesia maintained a low percentage of military personnel relative to its population, starting at 0.2% in the late 1980s. Discover Indonesia’s data on TGM StatBox.
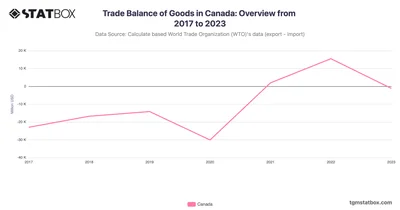
Canada’s trade balance fluctuated, peaking in 2022 before returning to a slight deficit in 2023. Discover more statistics and insights on TGM StatBox.
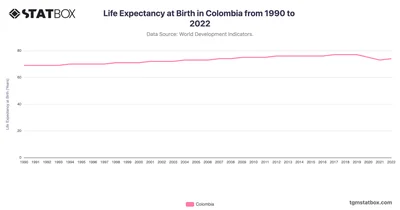
Colombia’s life expectancy rose from 69 in 1990 to 77 in 2022, reflecting healthcare access and public health improvements. Discover more statistics and insights on TGM StatBox.
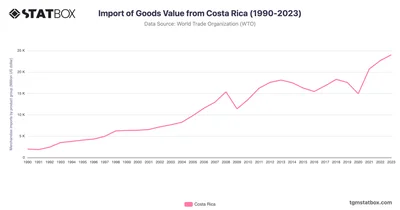
Costa Rica’s imports grew from $1.9B in 1990 to $24B in 2023, reflecting industrial and consumer demand. Discover more statistics and insights on TGM StatBox.
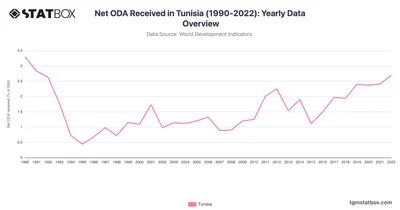
Tunisia’s Net ODA peaked at 3.3% in 1990, rising to 2.7% in 2022 amid economic challenges. Discover more statistics and insights on TGM StatBox.
 Pro
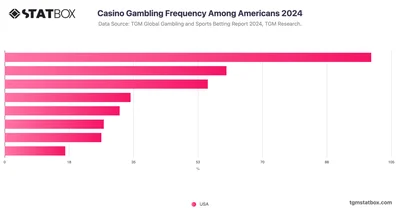
Analyze the frequency of casino gambling among Americans with this TGM Statbox chart, offering data on the popularity of casino activities.
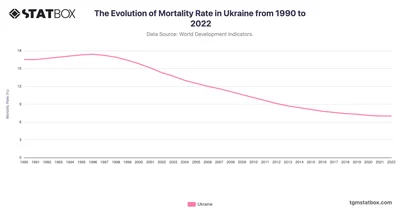
Ukraine’s mortality rate decreased from 16.5 in 1990 to 7.0 in 2022, reflecting healthcare reforms despite socio-economic challenges. Discover more insights on TGM StatBox.
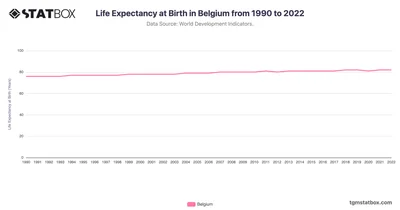
Belgium’s life expectancy increased from 76 in 1990 to 82 in 2022, reflecting advanced healthcare systems. Discover more statistics and insights on TGM StatBox.
 Pro
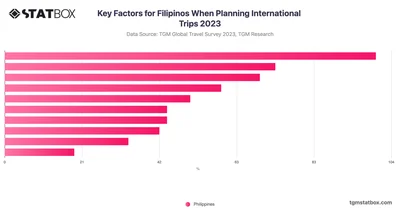
Filipinos prioritize cost when planning international trips, with 48% emphasizing budget-friendly options, significantly influencing their travel decisions.
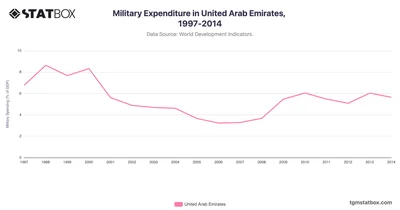
The UAE's military spending as a share of GDP has demonstrated both consistency and strategic responsiveness to regional dynamics from 1997 to 2014. Explore more data on TGM StatBox.
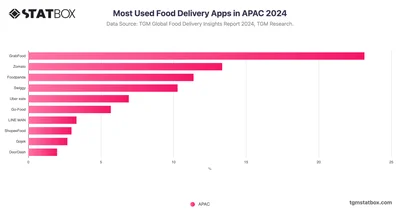
GrabFood leads in APAC with 23.2% usage, followed by Zomato and Foodpanda. Speed, trust, and value drive loyalty across this diverse, digital-savvy region.
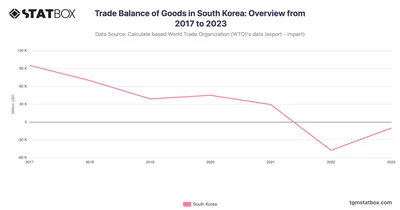
South Korea’s trade deficit narrowed in 2023 as exports rebounded in key sectors like semiconductors. Discover more statistics and insights on TGM StatBox.
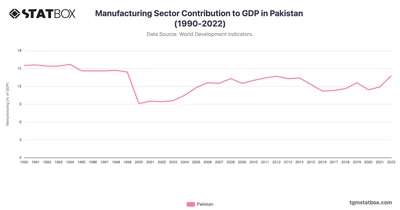
Pakistan’s manufacturing sector has faced fluctuations, with an initial decline from 15.5% in 1990 to 9.1% in 2000. See more Pakistan’s GDP data on TGM StatBox.
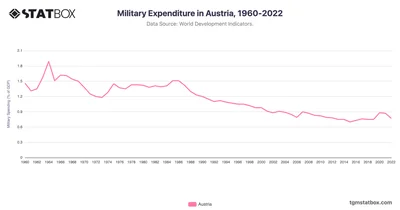
Austria's defense spending stabilized at 1% post-1990, aligned with its neutral stance. Learn more statistics and insights on TGM StatBox.
 Pro
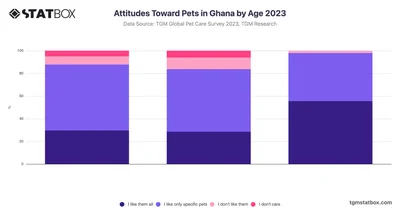
Among younger adults aged 18-24, 57% prefer specific pets, while this figure decreases to 42% for those aged 35-44. Only 2% of individuals aged 35-44 reported disliking pets.
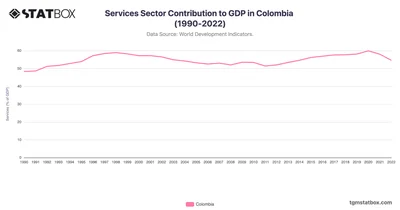
Colombia’s services sector rose steadily from 48.3% in 1990, peaking at 59.9% in 2020. Find more Colombia’s GDP data over the decades on TGM StatBox.
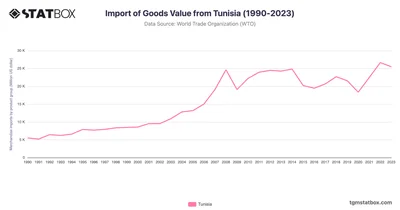
Tunisia’s imports grew from $5.5B in 1990 to $26.6B in 2022, reflecting consumer and industrial demand. Discover more statistics and insights on TGM StatBox.
 Pro
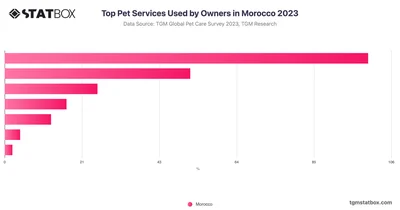
Veterinary care leads the way, with nearly half of pet owners utilizing these services. Grooming follows, appealing to about a quarter of pet owners.
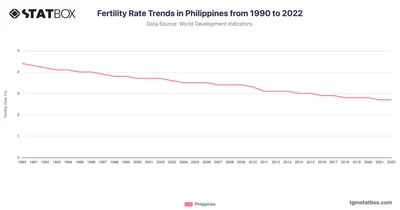
Track fertility shifts in the Philippines from 1990 to 2022, revealing population growth trends. Discover more statistics and insights on TGM StatBox.
 Pro
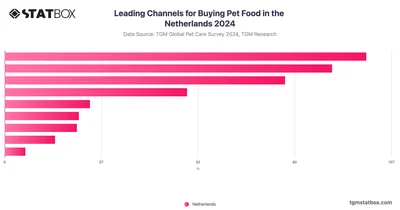
The primary channel for purchasing pet food in the Netherlands is supermarkets, with 37.41% of respondents favoring this option. This is followed by pet specialty chains, like Maxi Zoo.