Insights library
Explore a wide range of consumer insights and statistics across industries. Discover charts on behaviors, preferences, attitudes, and market trends to find the data most relevant to your research and decision-making.
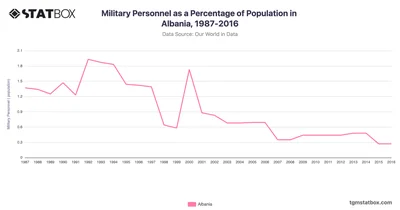
Albania’s military personnel as a percentage of the population showed significant fluctuation from 1987 - 2016. Check full data on Albania’s military personnel share on TGM StatBox.
 Pro
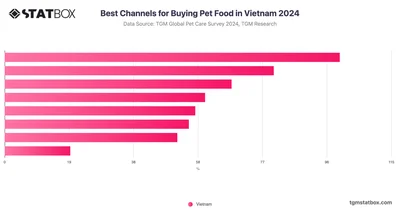
In Vietnam, online platforms are the most popular channel for purchasing pet food and supplies, with 52% of respondents choosing digital shopping.
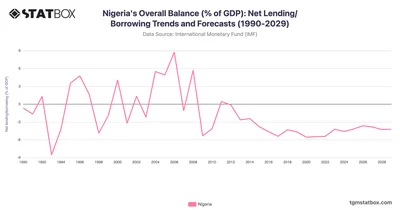
Nigeria’s fiscal swings reflect oil revenue dependency and reform challenges, with deficits persisting. Discover more statistics and insights on TGM StatBox.
 Pro
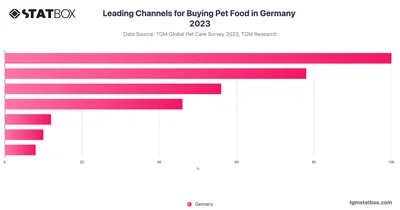
In Germany, supermarkets are the preferred choice for purchasing pet food, with 50% of respondents selecting this option, while online platforms are gaining popularity.
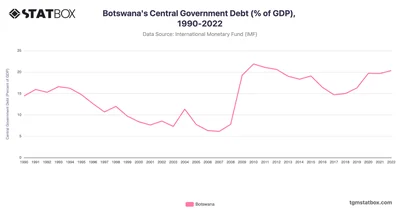
Botswana’s debt rose to 21.89% in 2010, stabilizing at 20.35% by 2022 amid fiscal discipline. Learn more statistics and insights on TGM StatBox.
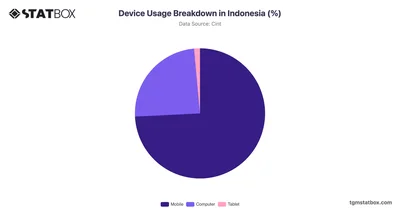
Indonesia shows a high preference for mobile devices at 74.21%, indicating a strong trend towards mobile-first engagement. Discover more on TGM StatBox.
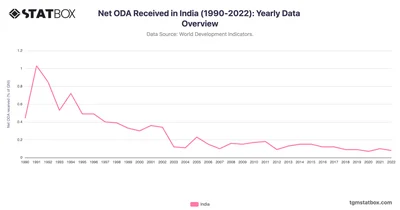
India’s Net ODA peaked at 1% in 1991, stabilizing at minimal levels post-2000 as its economy grew. Discover more statistics and insights on TGM StatBox.
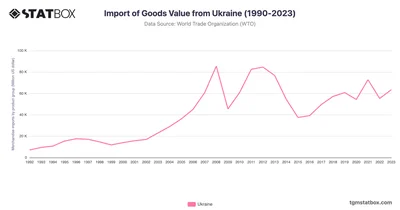
Ukraine’s imports rose from $7.1B in 1992 to $63.5B in 2023, highlighting industrial and geopolitical influences. Discover more statistics and insights on TGM StatBox.
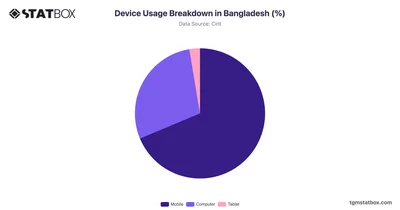
Bangladesh shows a solid preference for mobile devices, with 68.69% usage. Discover more about device usage breakdown in Bangladesh, on TGM StatBox.
 Pro
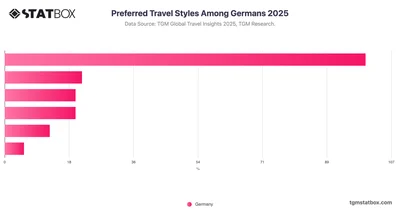
Travel for many Germans is about slowing down and recharging. Over half say relaxation trips suit them best, whether it's unwinding by the sea or escaping into nature.
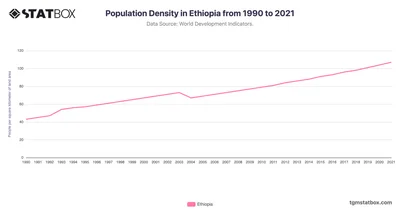
Ethiopia’s population density has consistently increased from 1990 to 2021. Explore the full data on Ethiopia’s population density over the decades on TGM StatBox.
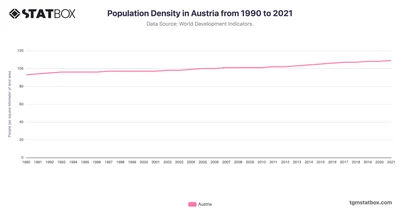
Austria's population density showed a consistent but moderate increase from 93 people per square kilometer in 1990 to 109 by 2021. Discover more on TGM StatBox.
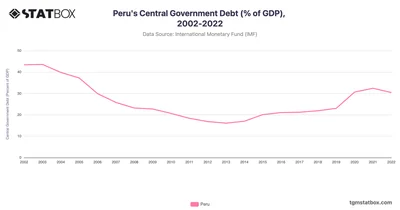
Peru’s debt rose to 32.43% in 2021, easing to 30.41% by 2022 amid economic recovery. Discover more statistics and insights on TGM StatBox.
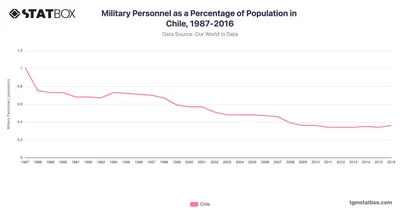
Chile’s military personnel percentage decreased from 1.0% in 1987 to 0.4% by 2016. Discover data on Chile’s military personnel share on TGM StatBox.
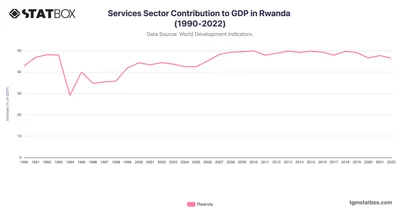
Rwanda's services sector has consistently contributed a significant portion to the country's GDP over the past few decades. Find more data at TGM StatBox.
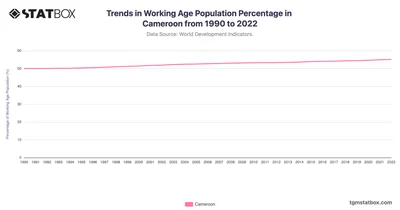
The chart illustrates the gradual increase in Cameroon’s working-age population percentage from 1990 to 2022. Discover the complete data on Cameroon’s population on TGM StatBox.
 Pro
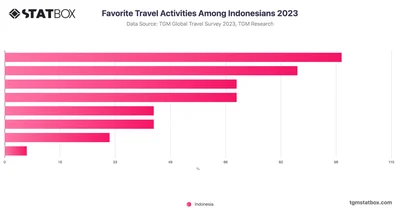
Indonesian travelers prioritize beach and leisure activities, with 61% favoring this category, reflecting a trend seen in global patterns, especially in Latin America.
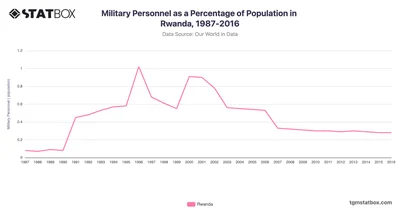
Rwanda's military personnel data from 1987 to 2016 reflects significant fluctuations that closely mirror Rwanda's periods of conflict, stabilization, and reform.
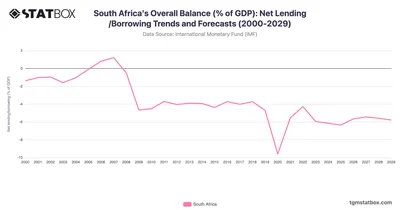
South Africa’s fiscal deficits highlight persistent challenges, with future improvements projected. Discover more statistics and insights on TGM StatBox.
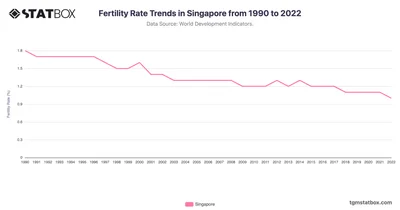
Analyze Singapore's fertility trends from 1990 to 2022, highlighting challenges in sustaining population growth. Discover more statistics and insights on TGM StatBox.
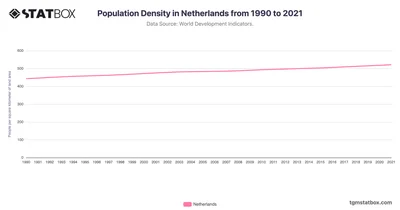
The Netherlands has one of the highest population densities globally, growing from 443 people per square kilometer in 1990 to 521 by 2021. See the full data on TGM StatBox.
 Pro
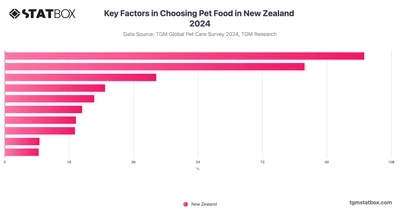
When it comes to selecting pet food, price emerges as the most significant factor for consumers in New Zealand, surpassing the importance of quality.
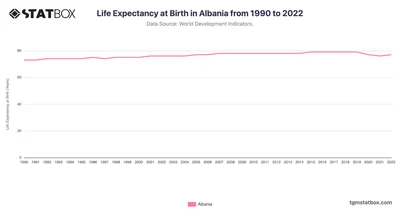
Albania’s life expectancy rose from 73 in 1990 to 77 in 2022, showcasing healthcare and living standard improvements. Discover more statistics and insights on TGM StatBox.
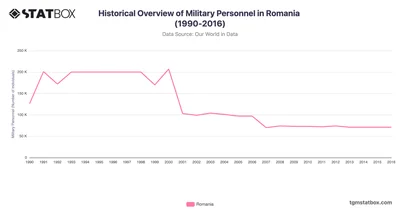
Romania's military personnel count fluctuated significantly, peaking at 201,000 in 1991 before steadily declining to 71,000 by 2016. Discover more on TGM StatBox.
 Pro
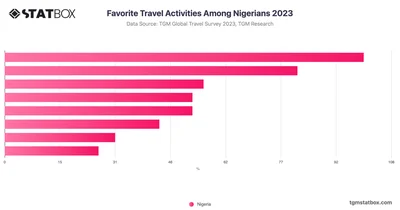
Nigerian travel activities reflect diverse interests, with shopping leading as the most popular pursuit for 65% of travelers.
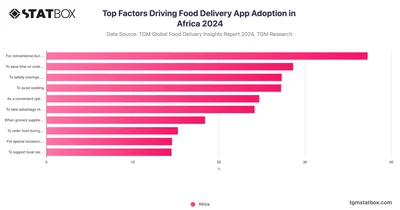
Africans use food delivery apps for ease, comfort, and convenience—during busy days, bad weather, low groceries, or to enjoy discounts and satisfy cravings.
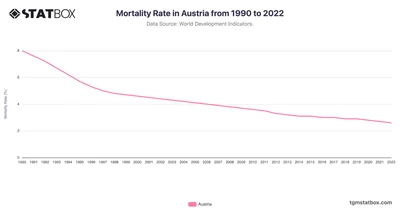
Austria’s mortality rate fell from 8.0 in 1990 to 2.6 in 2022, showcasing robust healthcare reforms. Discover more statistics and insights on TGM StatBox.
 Pro
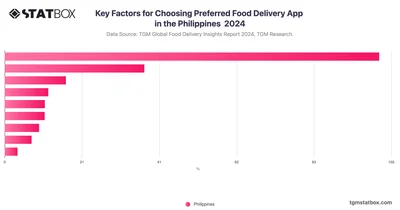
Trust drives food delivery choices in the Philippines—48% pick apps they trust most, with speed and reliability also key to winning customer loyalty.
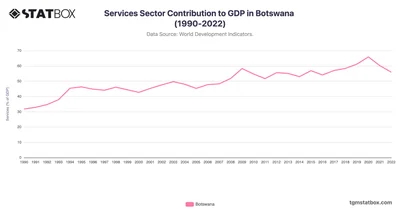
The Services sector in Botswana rose significantly, from 31.8% in 1990 to a peak of 65.9% in 2020. Find more Botswana's GDP data over the years on TGM StatBox.
 Pro
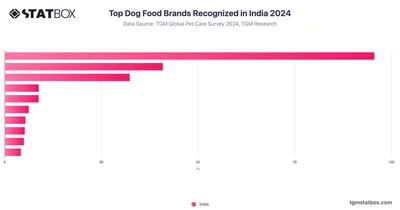
In India, Pedigree is the top dog food choice at 76.49%, followed by Royal Canin at 32.72%, known for its tailored formulations, and Drools.