Insights library
Explore a wide range of consumer insights and statistics across industries. Discover charts on behaviors, preferences, attitudes, and market trends to find the data most relevant to your research and decision-making.
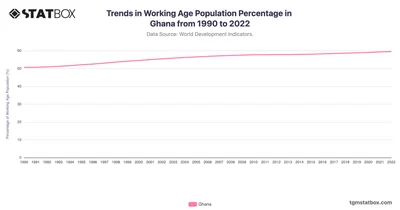
The chart highlights the trends in Ghana’s working-age population from 1990 to 2022. Discover the complete data on Ghana’s working-age population on TGM StatBox.
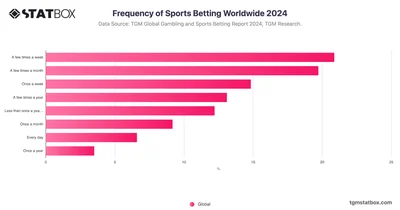
Sports betting frequency varies significantly worldwide, with the highest percentage of bettors placing bets a few times a week. Learn more statistics on TGM StatBox.
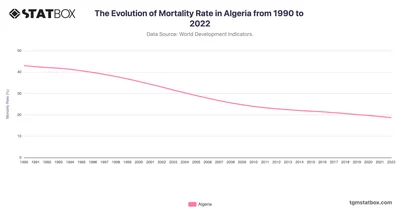
Explore Algeria's mortality rate decline from 43.0 in 1990 to 18.7 in 2022, showcasing healthcare progress and public health reforms. Discover more statistics and insights on TGM StatBox.
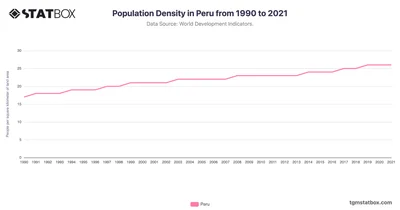
Peru’s population density increased gradually from 17 people per square kilometer in 1990 to 26 in 2021. See the full Peru’s population density data on TGM StatBox.
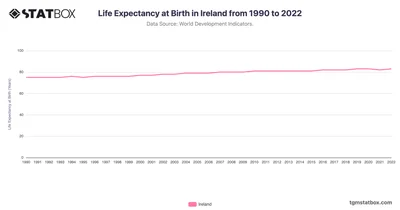
Ireland’s life expectancy grew from 75 in 1990 to 83 in 2022, driven by economic growth and healthcare improvements. Discover more statistics and insights on TGM StatBox.
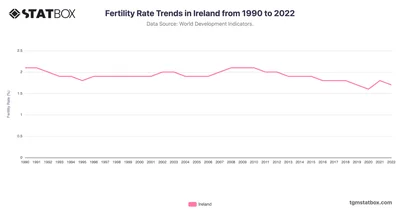
Track Ireland's fertility patterns from 1990 to 2022, showcasing population changes in a rapidly evolving economy. Discover more statistics and insights on TGM StatBox.
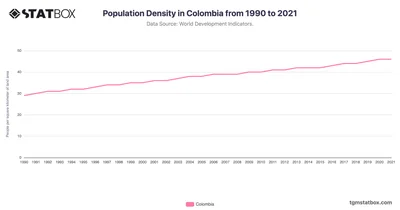
Colombia's population density rose from 29 to 46 people per square kilometer, showing a steady upward trend driven by urban migration and population growth.
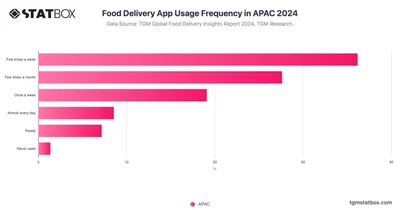
Food delivery app usage in the APAC region is widespread, with over 91% of respondents reporting that they have used such apps at least once.
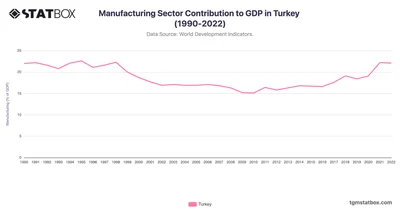
The manufacturing sector's contribution to Turkey's GDP has demonstrated notable fluctuations between 1990 and 2022. Find more data and insights on TGM StatBox.
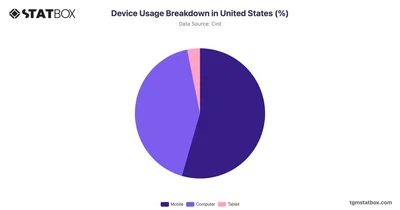
The United States shows a relatively balanced device usage distribution, with 54.48% on mobile and 42.34% on computers. Discover more data on TGM StatBox.
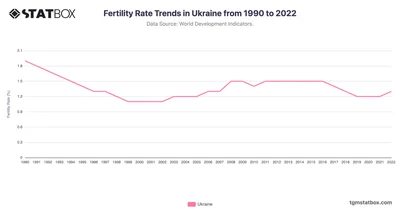
Discover Ukraine's fertility rate shifts from 1990 to 2022, reflecting demographic challenges amid socio-political changes. Discover more statistics and insights on TGM StatBox.
 Pro
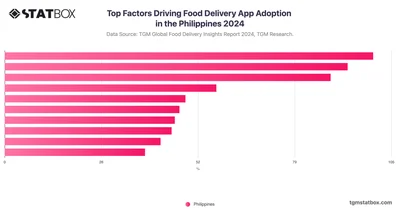
Convenience is the main reason Filipinos use food delivery apps—helping with busy schedules, saving time, and making everyday life easier and more flexible.
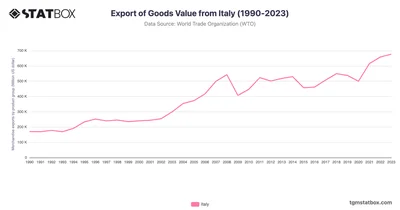
Track Italy's export rise from 1990 to 2023, focusing on luxury goods and machinery. Discover more statistics and insights on TGM StatBox.
 Pro
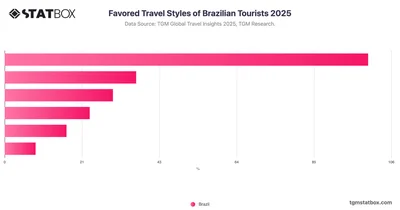
Brazilian tourists (47%) show a strong preference for leisure-focused travel. They also want to travel to explore culture and seek health and well-being getaways.
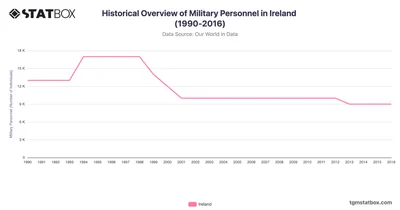
Ireland's military personnel experienced modest changes, starting at 13,000 in 1990. Discover more Ireland's statistics and insights on TGM StatBox.
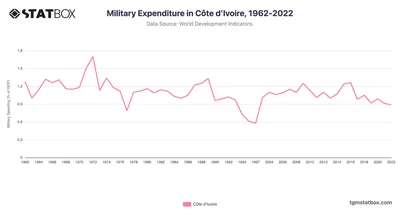
Côte d'Ivoire's defense spending stabilized at 0.9% in 2022 amid recovery. Find more statistics and insights on TGM StatBox.
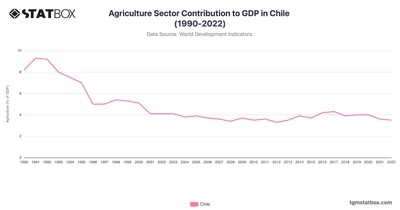
Chile's agriculture sector contribution to GDP saw a steady decline from 9.3% in 1991 to about 3.5% by 2022. Discover the full Chile's agriculture GDP data at TGM StatBox.
 Pro
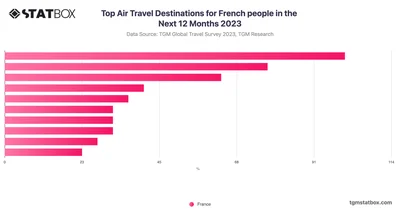
French travelers prioritize Western Europe, with 22% planning to visit, a preference driven by cultural ties and geographical proximity that enhance ease of travel.
 Pro
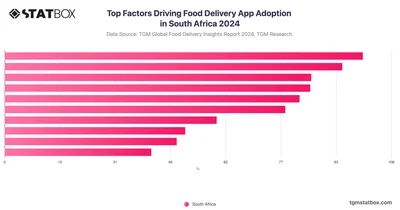
In South Africa, 32.4% use food delivery apps for convenience during busy schedules—showing how these services support practical, time-saving daily routines.
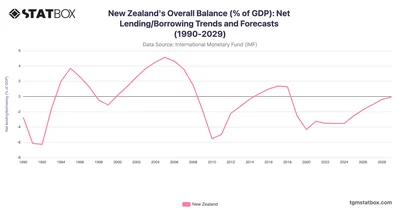
New Zealand’s fiscal position reflects resilience, with gradual deficit narrowing forecasted. Discover more statistics and insights on TGM StatBox.
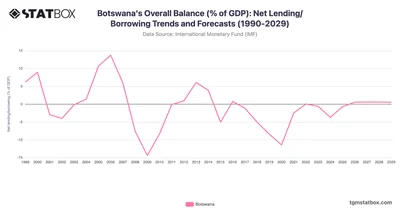
Botswana’s fiscal journey includes sharp swings from surpluses to deficits, influenced by commodity cycles and reforms. Discover more statistics and insights on TGM StatBox.
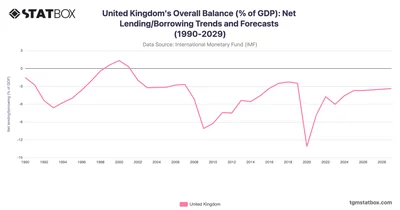
The UK’s fiscal challenges persist post-pandemic, with gradual improvement projected. Discover more statistics and insights on TGM StatBox.
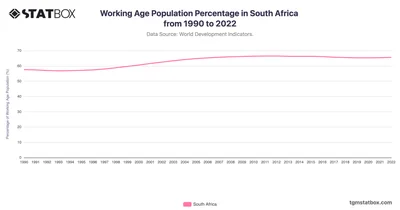
In South Africa, the working-age population percentage rose from 57.6% in 1990, peaking at around 66.5% in the early 2010s. Discover the complete data on TGM StatBox.
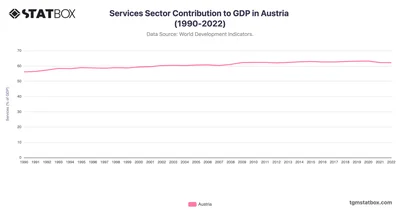
Austria’s services sector steadily grew, starting at 56.1% of GDP in 1990 and reaching 63.2% by 2020. Find more Austria’s GDP data on TGM StatBox.
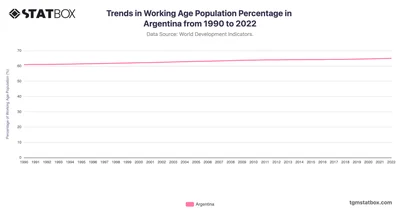
From 1990 to 2022, Argentina's working-age population steadily increased from 60.9% to 65.0%. Discover complete data on Argentina's working-age population on TGM StatBox.
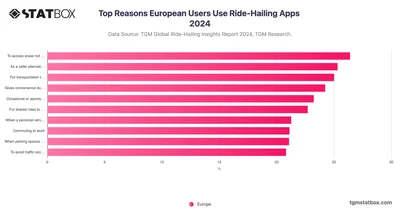
In Europe, users turn to ride-hailing applications for various practical reasons, with convenience and accessibility being the most prominent.
 Pro
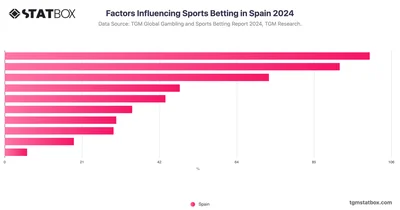
Examine the factors influencing sports betting in Spain, from cultural drivers to market trends, in this comprehensive TGM Statbox chart.
 Pro
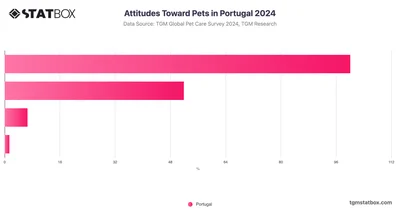
In Portugal, the prevailing attitude toward pets is predominantly positive, with 62.57% of respondents expressing that they "like them all."
 Pro
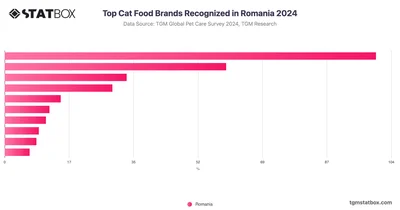
The most popular pet food brand in Romania that pet owners typically feed their cats is Whiskas, which leads with approximately 57.6% of respondents choosing it.
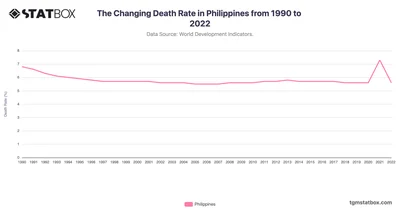
The Philippines’ death rate trends underline healthcare progress and persistent health challenges. Discover more statistics and insights on TGM StatBox.