Share the statistic on social media channels or embed the statistic in your website using "Embed Code", where available.
Share chart
Embed chart Embed copied!Cite this statistic and select one of the following formats: APA, Chicago, Harvard, MLA & Bluebook
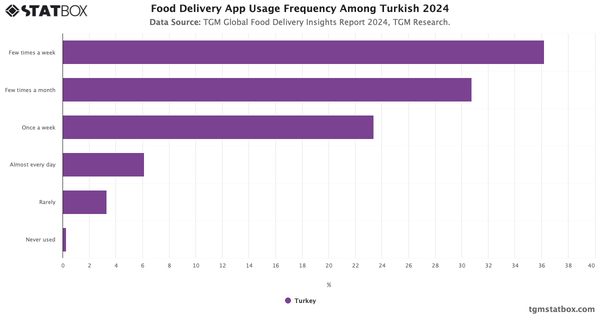
"How often do you use food delivery app?"
Key Takeaways
The adoption of food delivery services in the UK is relatively high, with only 0.48% of people having never used a food delivery app. A significant portion of the population uses these apps on a regular basis, with 47.85% ordering at least once a week and 36% using the services a few times a month.

Food Delivery Insights Report in the UK
Discover all you need to know about Food Delivery in the UK with TGM StatBox. Get the comprehensive report, featuring graphs and tables for insights.
Go to report


Connect with our expert team for immediate assistance or comprehensive market analysis. We are always ready to support your business needs.