Charts library
Not sure where to start? Dive into a diverse selection of charts and data visualizations across topics, and find the information you need to drive your research and analysis.
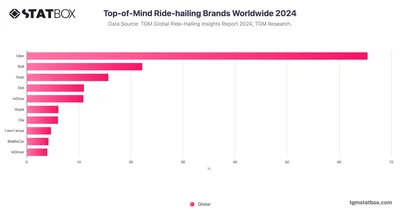
Uber stands out as the most recognized brand globally, with 65.4% of respondents naming it first. Uber's strong brand presence is setting the standard for users' expectations and trust across regions.
 Pro
Pro
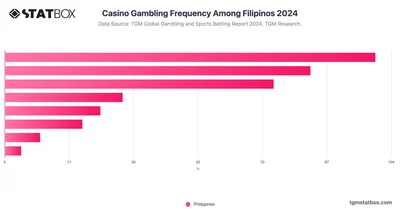
Casino Gambling Frequency Among Filipinos | TGM Statbox Chart: Explore the frequency of casino gambling among Filipinos with TGM Statbox's detailed chart.
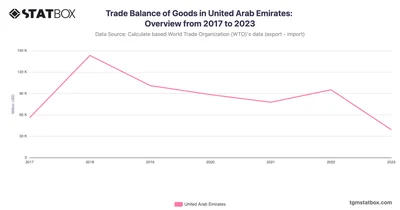
The UAE’s trade surplus moderated in 2023 as oil prices stabilized, though non-oil exports remained robust. Discover more statistics and insights on TGM StatBox.
 Pro
Pro
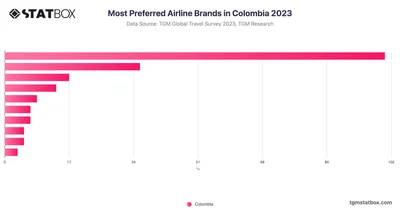
Avianca stands as the top choice for Colombian travelers, commanding 58.6% of surveyed preferences, cementing its position as the most preferred airline.
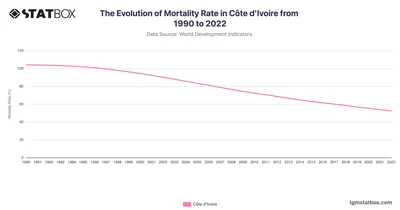
Côte d'Ivoire's mortality rate declined from 104.1 in 1990 to 52.4 in 2022, showcasing significant public health improvements. Discover more statistics on TGM StatBox.
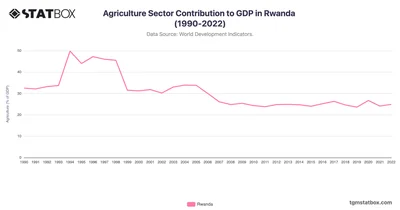
The agriculture sector in Rwanda has experienced significant fluctuations in its contribution to GDP over the past three decades. Discover more on TGM StatBox.
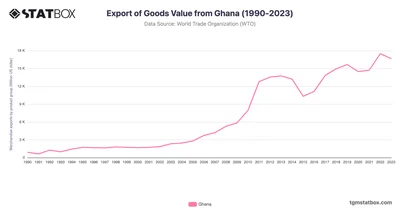
Analyze Ghana's export trends from 1990 to 2023, highlighting cocoa and gold as key contributors. Discover more statistics and insights on TGM StatBox.
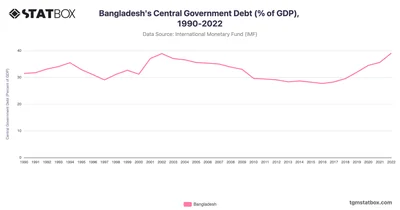
Bangladesh's debt climbed to 39.09% in 2022, up from 28.34% in 2013, driven by fiscal stimulus. Find more statistics and insights on TGM StatBox.
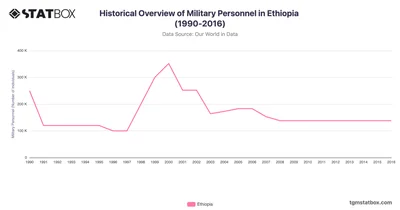
Ethiopia experienced significant fluctuations in its military personnel numbers between 1990 and 2016. Discover more statistics and insights on TGM StatBox.
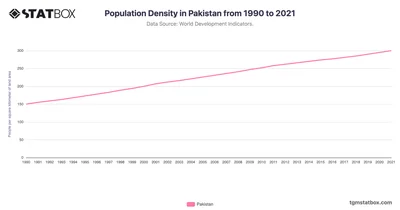
Pakistan’s population density surged from 150 people per square kilometer in 1990 to 300 in 2021. See the full Pakistan’s population density data on TGM StatBox.
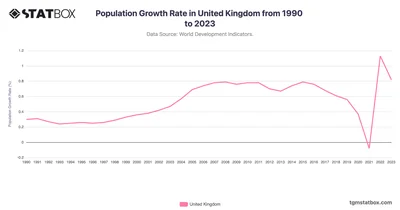
Analyze the UK’s population growth, influenced by migration and aging trends. Discover more statistics and insights in your target country on TGM StatBox.
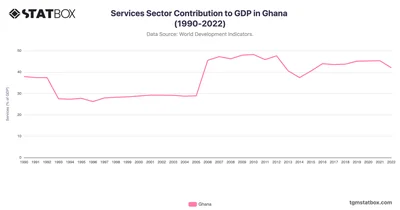
Ghana's services sector contribution increased notably post-2006, reaching 45.3% in 2021 from just 27.5% in 1993. Find more Ghana's GDP data on TGM StatBox.
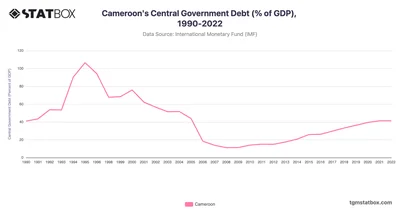
Cameroon’s debt peaked at 106.49% in 1995, declining to 41.31% by 2021 amid debt relief. Find more statistics and insights on TGM StatBox.
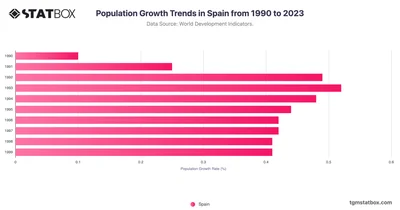
Understand Spain's population growth influenced by migration and demographic shifts. Discover more statistics and insights in your target country on TGM StatBox.
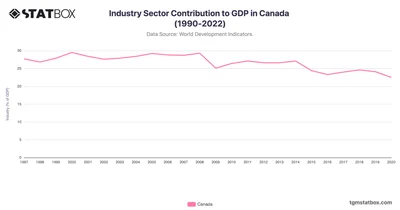
Canada’s industry sector has fluctuated moderately since the late 1990s, influenced by global commodity prices and shifts in North American trade dynamics.
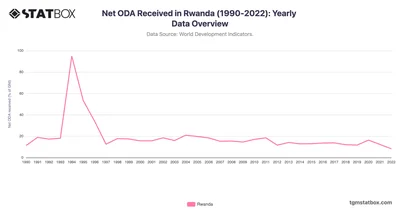
Rwanda’s Net ODA peaked at 94.9% in 1994, declining to 8.3% in 2022 amid economic stabilization. Discover more statistics and insights on TGM StatBox.
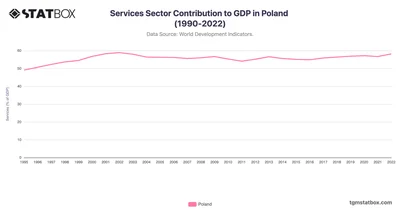
By 2022, Poland’s services sector contributed 58.2%, marking resilience and adaptability in Poland’s economy. Find more Poland’s GDP data over the years on TGM StatBox.
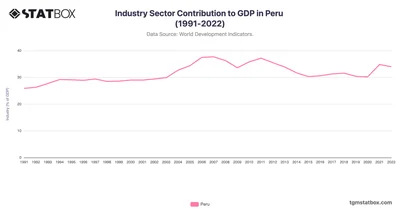
Peru’s industry sector contribution to GDP rose from 25.9% in 1991 to a high of 37.7% in 2007, driven by mining and construction booms, especially in copper and gold.
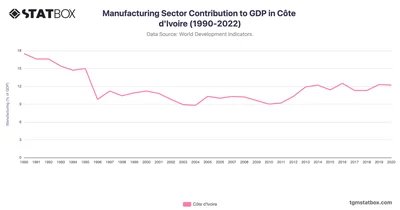
Côte d'Ivoire’s manufacturing contribution experienced fluctuations, starting at 17.5% in 1990, declining to 8.8% by 2004. See more Ivory Coast’s data on TGM StatBox.
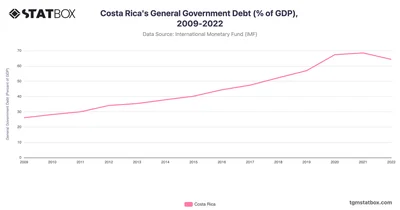
Costa Rica's debt as a share of GDP rose steadily from 26.1% in 2009 to 40.2% in 2015. Discover more Costa Rica's statistics on TGM StatBox.
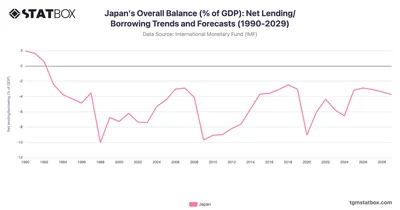
Japan’s persistent deficits highlight aging demographics and recovery challenges. Discover more statistics and insights on TGM StatBox.
 Pro
Pro
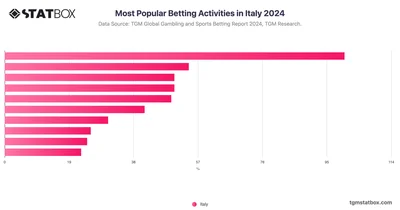
In Italy, the most popular betting activities over the past 12 months include placing sports bets online or through apps, which was reported by 52.74% of respondents.
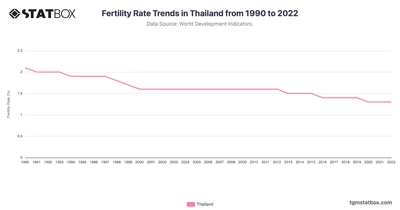
Analyze Thailand's fertility trends from 1990 to 2022, highlighting population changes shaped by regional growth. Discover more statistics and insights on TGM StatBox.
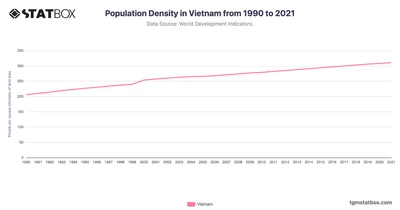
Vietnam’s population density rose significantly, from 206 people per square kilometer in 1990 to 311 by 2021, reflecting rapid urbanization and economic reforms.
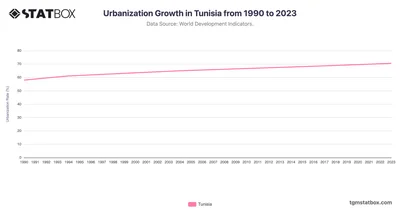
Tunisia’s urban population grew from 57.9% in 1990 to 70.5% in 2023, fueled by demographic shifts and government policies promoting urban development.
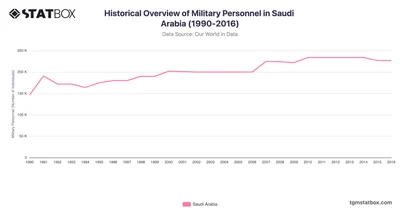
Saudi Arabia's military personnel numbers steadily increased from 146,000 in 1990 to a peak of 234,000 in 2010, maintaining this level until 2014. More on TGM StatBox.
 Pro
Pro
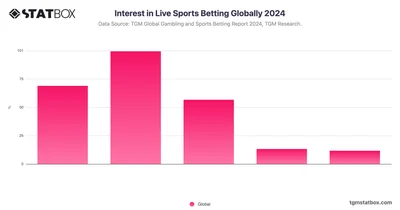
The global interest in live sports betting, where 67% of respondents express a desire to place bets in real time as they watch games. Find more betting statistics on TGM StatBox.
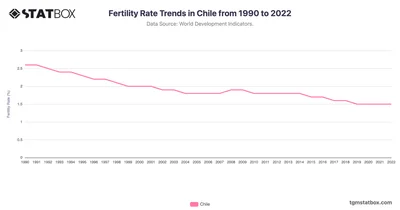
Discover Chile's fertility trends from 1990 to 2022, highlighting population dynamics amidst socio-economic changes. Discover more statistics and insights on TGM StatBox.
 Pro
Pro
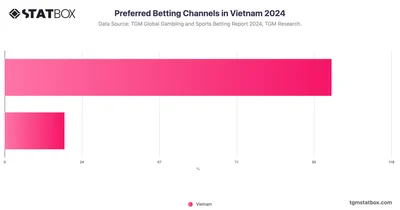
84.5% of respondents prefer online and mobile app-based sports betting, valuing convenience, though some still enjoy in-person betting for social interaction.
 Pro
Pro
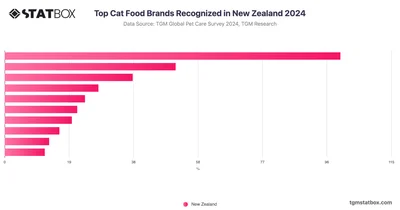
Whiskas holds the largest market share for cat food in New Zealand at 52.1%, with Purina and Chappie following at 26.5% and 19.9%, respectively.






