Insights library
Explore a wide range of consumer insights and statistics across industries. Discover charts on behaviors, preferences, attitudes, and market trends to find the data most relevant to your research and decision-making.
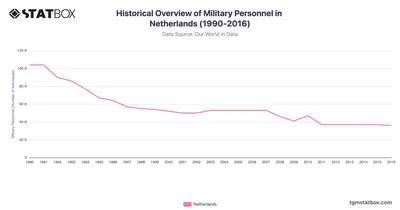
The Netherlands experienced a significant reduction in military personnel between 1990 and 2016, driven by defense policy changes and shifting global priorities.
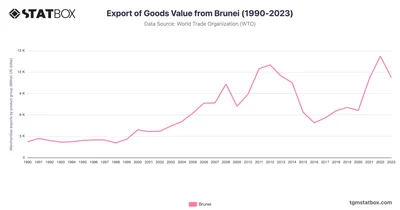
Explore Brunei's export trends from 1990 to 2023, dominated by oil and gas revenues. Discover more statistics and insights on TGM StatBox.
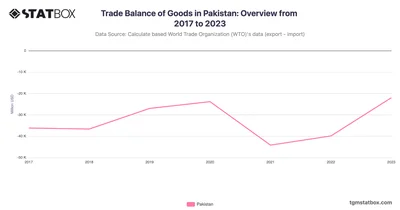
Pakistan’s trade deficit narrowed sharply in 2023 as import restrictions and tighter fiscal policies took effect. Discover more statistics and insights on TGM StatBox.
 Pro
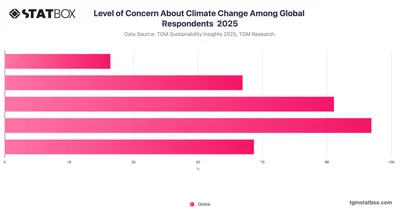
Around the world, most people care about climate change, but not everyone feels the same. Almost half of people are highly concerned. Another 26% are moderately concerned.
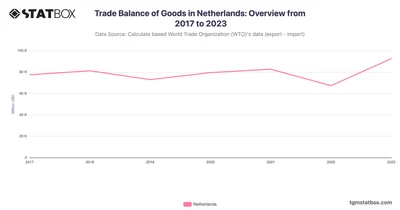
The Netherlands recorded its highest trade surplus in 2023, driven by robust exports of chemicals and machinery. Discover more statistics and insights on TGM StatBox.
 Pro
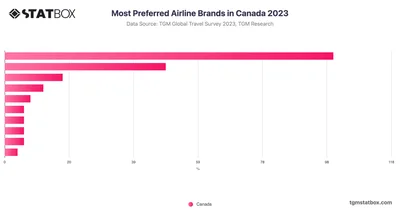
Air Canada dominates as the most preferred airline among Canadians, securing 50.6% of the votes. WestJet also holds a substantial share with 25.1%.
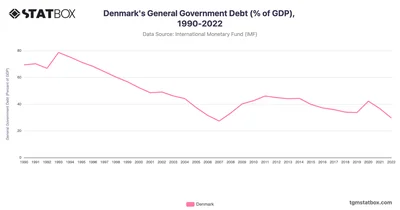
Denmark saw a notable decrease in its government debt-to-GDP ratio from the early 1990s to the early 2000s. Discover more statistics on TGM StatBox.
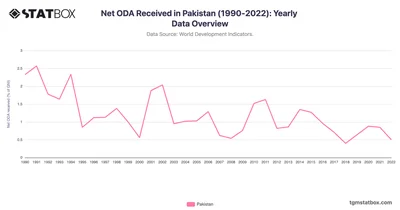
Pakistan’s Net ODA peaked at 2.6% in 1991, stabilizing at 0.5-0.9% by 2022 as self-reliance grew. Discover more insights on TGM StatBox.
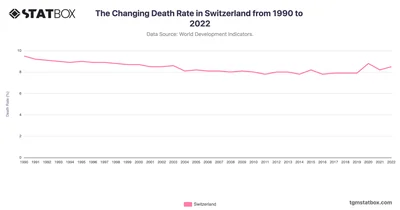
Switzerland’s death rate trends showcase healthcare progress and demographic shifts. Discover more statistics and insights on TGM StatBox.
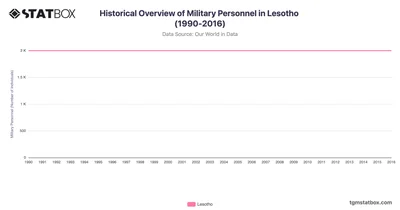
Lesotho maintained a constant military personnel level of 2,000 from 1990 to 2016, reflecting Lesotho’s limited defense budget and reliance on regional partnerships for security.
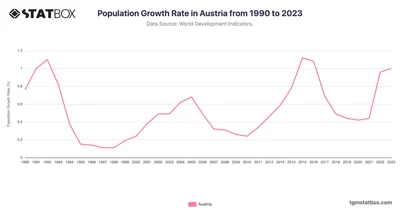
Examine Austria’s population growth, driven by migration and aging trends. Discover more statistics and insights in your target country on TGM StatBox.
 Pro
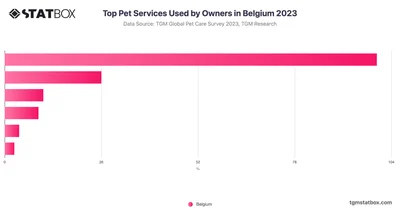
Belgian pet owners highly prioritize veterinarian services, with a significant 77% usage rate. Grooming services are also widely used in this market.
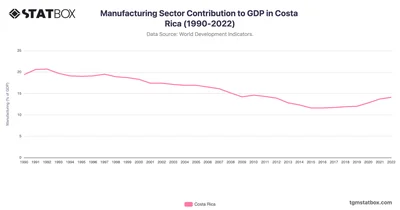
Costa Rica's manufacturing sector began at 19.4% in 1990, growing slightly in the early 1990s before starting a gradual decline. See more Costa Rica's data on TGM StatBox.
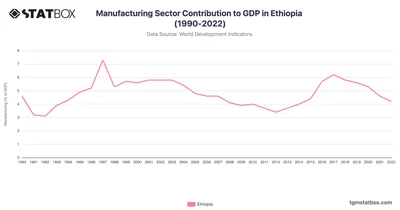
Ethiopia’s manufacturing sector maintained a low but steady GDP contribution over three decades, peaking at 7.3% in 1997. See more Ethiopia’s data on TGM StatBox.
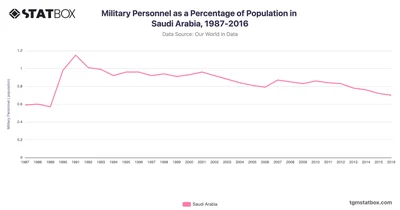
Saudi Arabia’s military personnel as a percentage of the population fluctuated significantly. Discover data on KSA’s military personnel share on TGM StatBox.
 Pro
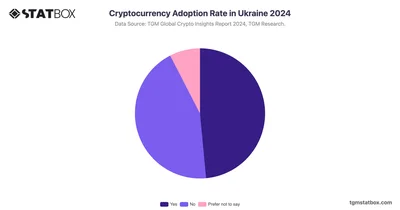
With 48.5% of Ukrainians having owned or used cryptocurrency, it’s clear that Ukraine has a relatively high level of adoption compared to many other countries.
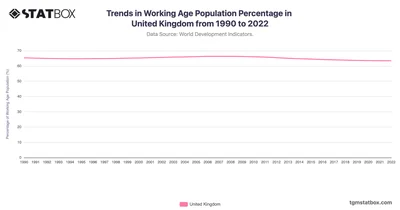
The UK's working-age population began at 65.3% in 1990, reaching a peak of 66.3% in 2007 during economic growth years. Discover the complete data on TGM StatBox.
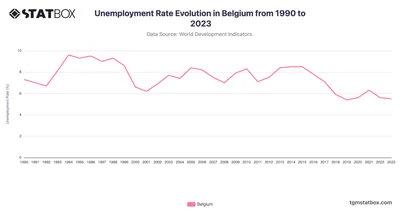
Belgium’s unemployment rate over the years mirrors its economic resilience amid periods of both growth and recession. Discover more statistics on TGM StatBox.
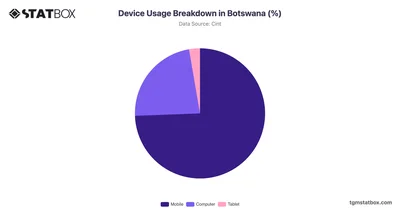
Botswana's device usage shows a strong preference for mobile devices at 74.41%. Discover more about device usage breakdown in Botswana, on TGM StatBox.
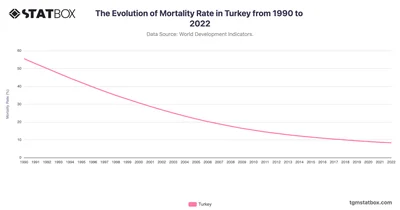
Turkey’s mortality rate declined from 55.5 in 1990 to 8.3 in 2022, reflecting expanded healthcare access. Discover more statistics and insights on TGM StatBox.
 Pro
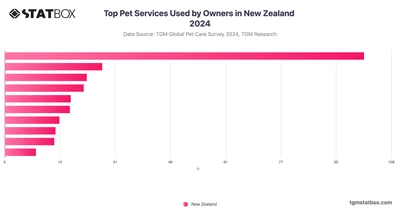
Looking at pet service usage in New Zealand, veterinary care is by far the most commonly used service at 65.07% of pet owners, followed by professional grooming at 14.86%.
 Pro
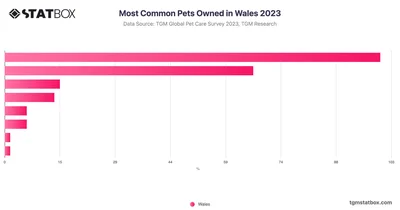
In Wales, dogs are the most popular pets, with 68% of pet owners having canine companions. Cats follow as the second most common pet, owned by 45% of Welsh pet owners.
 Pro
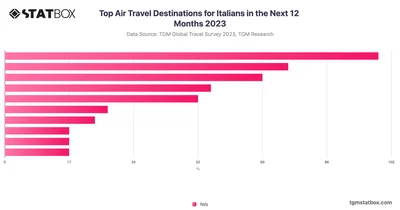
Central and Eastern Europe attract 22% of Italian travelers, offering rich history and emerging tourist attractions for those seeking diverse experiences beyond traditional spots.
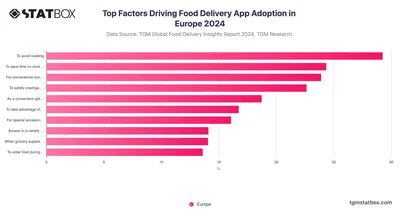
For Europeans, food delivery is about ease and comfort—mainly to avoid cooking and save time, not urgency or deals, but to simplify busy daily routines.
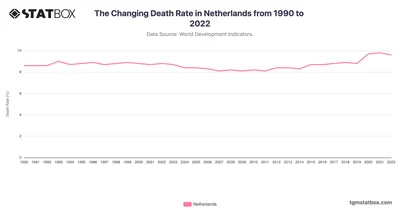
The Netherlands’ death rate illustrates public health improvements and demographic factors. Discover more statistics and insights on TGM StatBox.
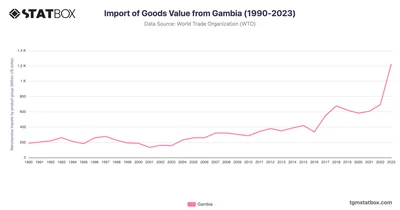
Gambia’s imports grew steadily, peaking at $1.2B in 2023, showcasing growth in consumer goods and infrastructure. Discover more statistics and insights on TGM StatBox.
 Pro
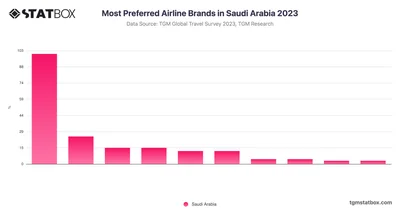
Saudia Airline holds a commanding 67.5% preference among travelers in Saudi Arabia, thanks to its trusted service and extensive network for domestic and international flights.
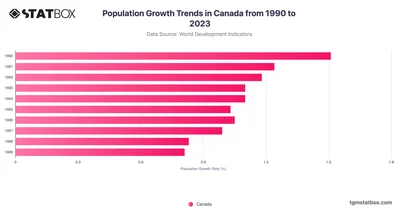
Understand Canada’s population growth fueled by immigration and urbanization. Discover more statistics and insights in your target country on TGM StatBox.
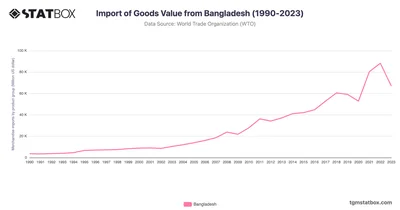
Bangladesh’s imports surged from $3.6B in 1990 to $88.2B in 2022, showcasing rapid industrial growth. Discover more statistics and insights on TGM StatBox.
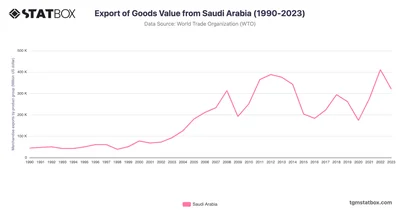
Review Saudi Arabia's export trends from 1990 to 2023, led by oil revenues and diversification efforts. Discover more statistics and insights on TGM StatBox.