Age-Based Divergence in Christmas Shopping Priorities in the USA
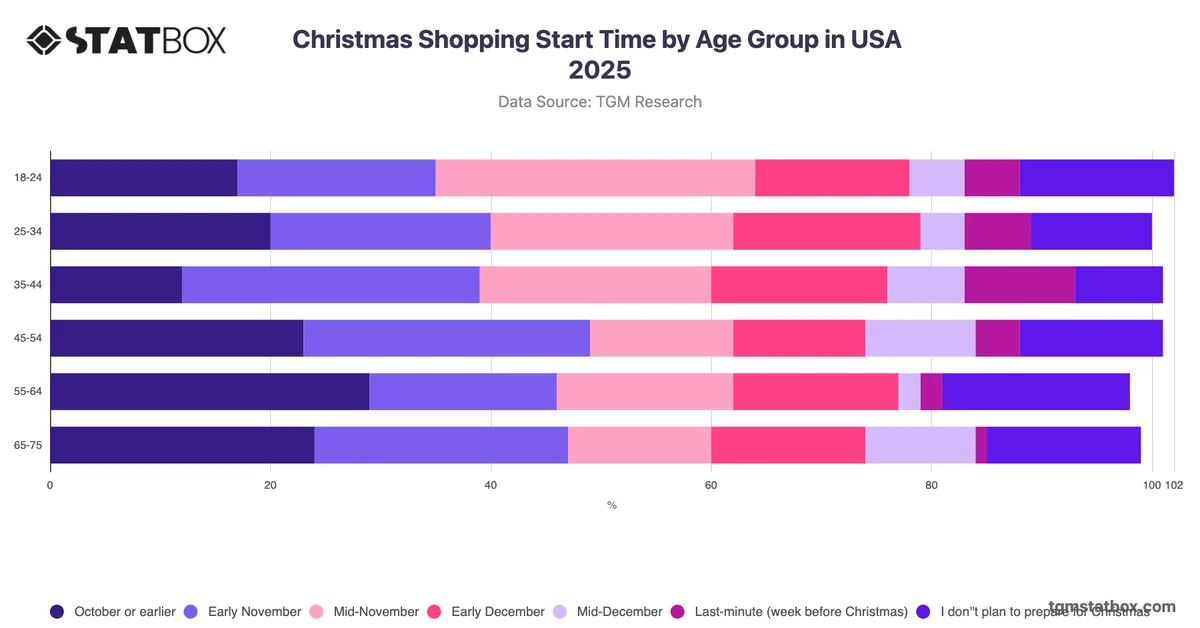
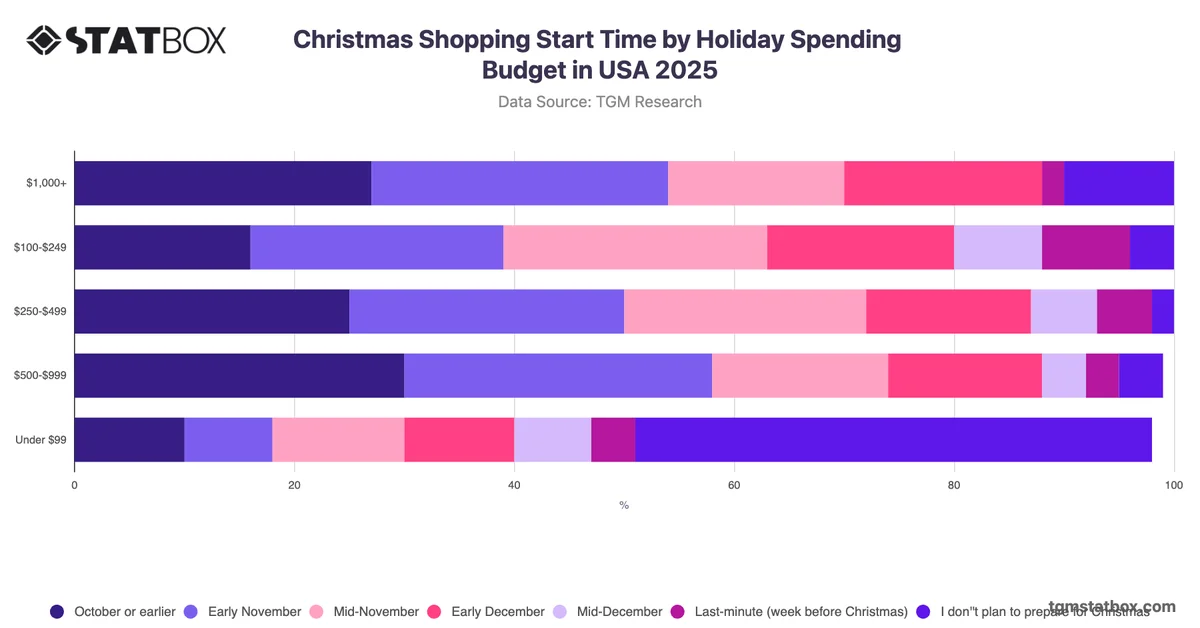
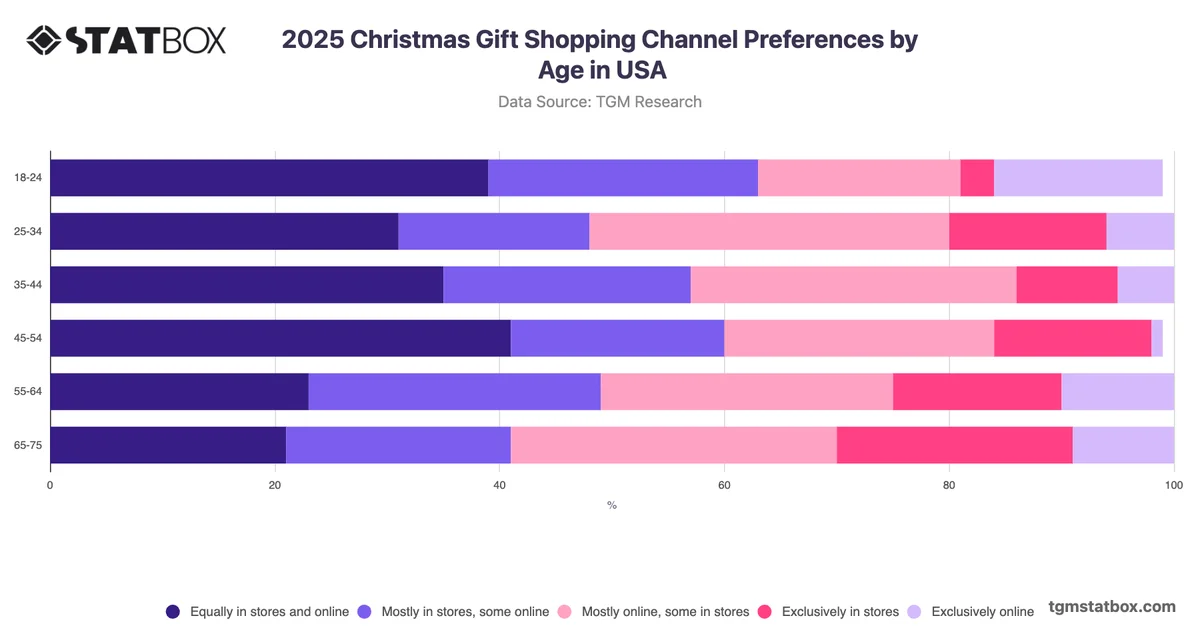
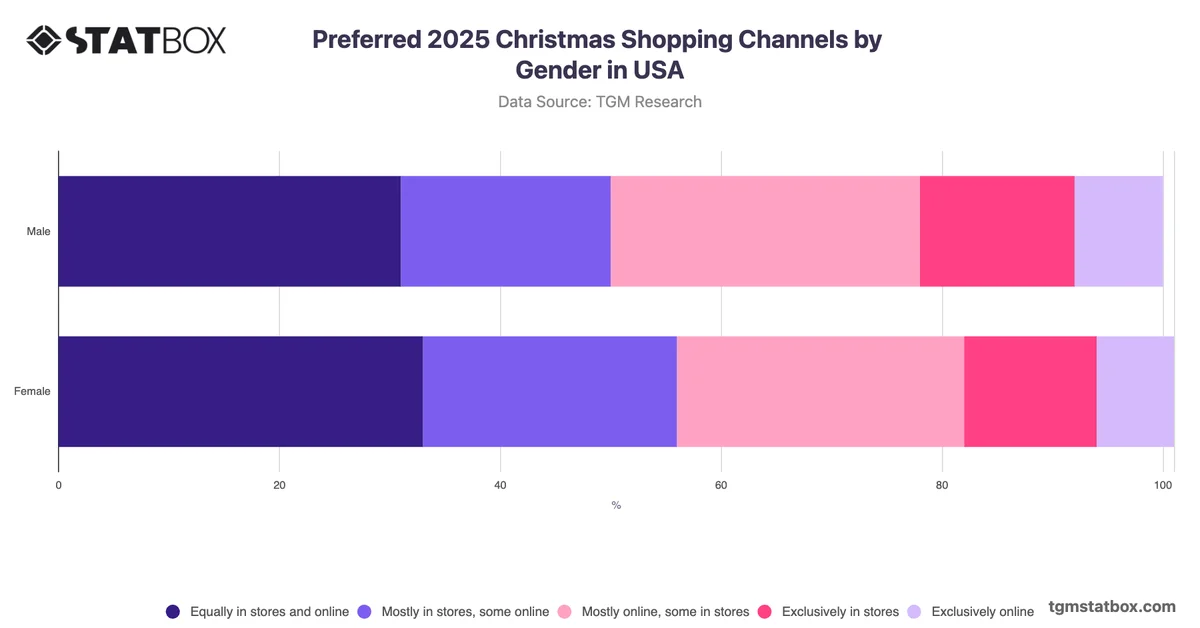
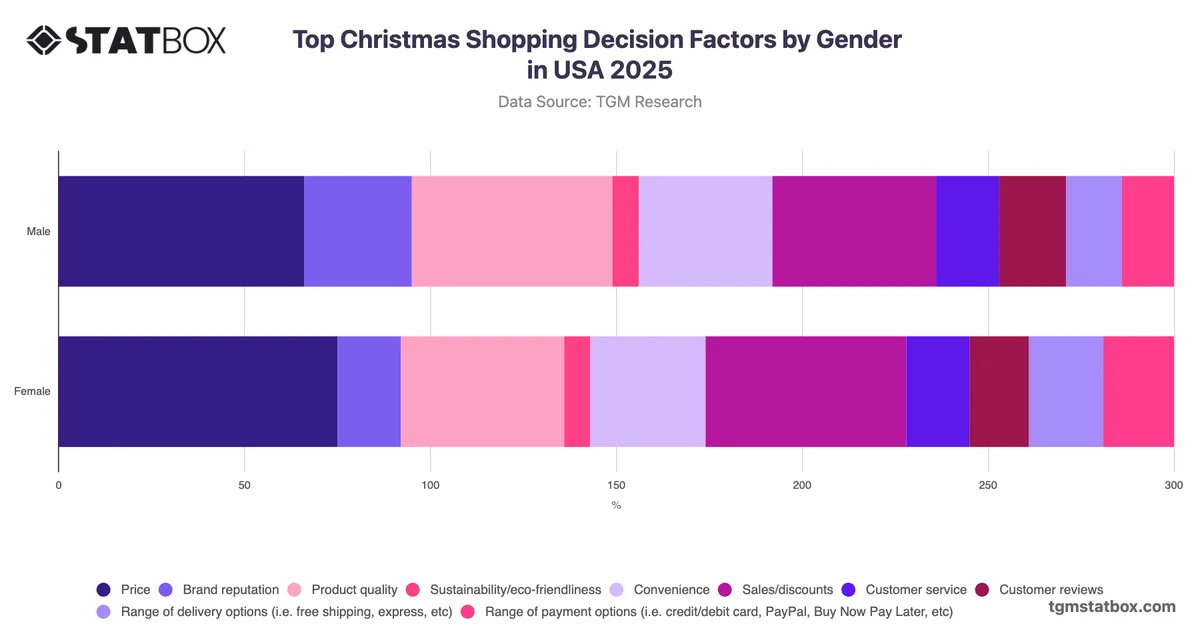
Christmas shopping decisions involve a complex interplay of financial, experiential, and logistical considerations. Price sensitivity, product quality, and promotional incentives each carry different weight depending on a consumer's life stage, household responsibilities, and purchasing habits, making age a meaningful lens through which to understand holiday retail behaviour.
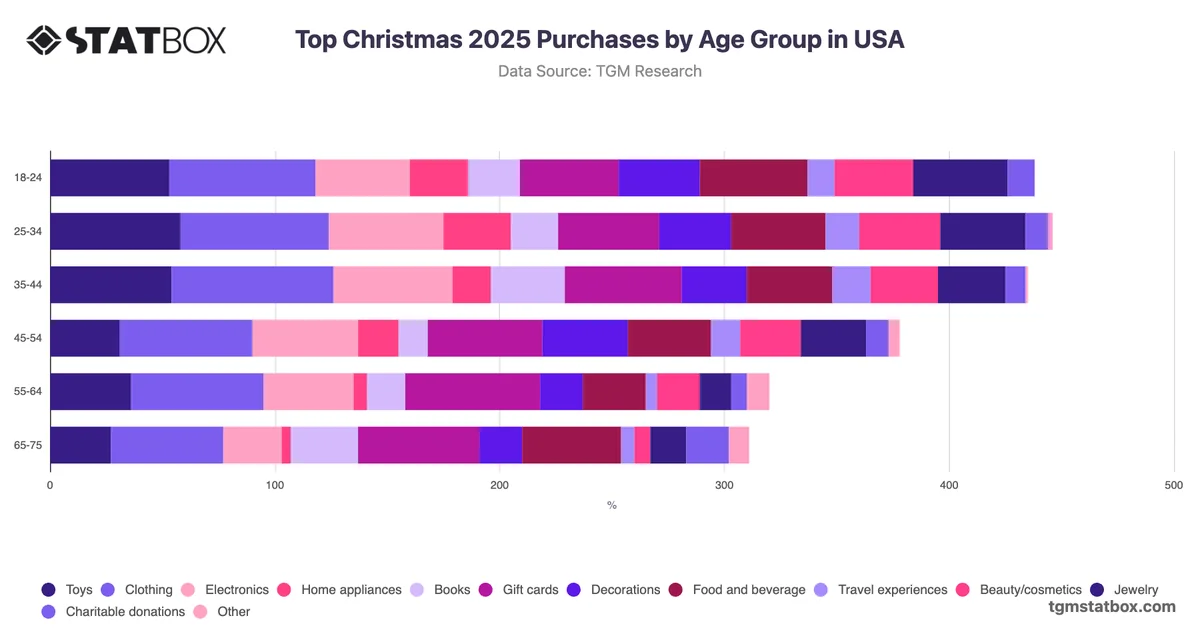
The most analytically significant pattern is the pronounced age gradient in price sensitivity. Among consumers aged 55 to 64 and 65 to 75, price is cited by 86% as a top decision factor, compared to 57% among 25 to 34 year olds, a gap of nearly 30 percentage points. This concentration at older age groups indicates that value-driven messaging may carry considerably more weight with mature consumers than with younger cohorts, who place comparatively greater emphasis on sales and discounts as a distinct lever. Sustainability considerations, by contrast, are largely absent among consumers aged 55 and above, suggesting that eco-focused positioning has limited traction beyond younger demographics. Retailers targeting mixed-age audiences during the Christmas period may benefit from segmenting promotional communications by age, prioritising price-led messaging for older consumers while directing discount and range-of-payment-option cues toward the 18 to 44 segment.