Price Sensitivity and Quality Trade-offs Across Christmas Spending Tiers
Christmas shopping decisions involve a complex interplay of financial constraints, perceived value, and personal priorities. Across spending levels, consumers weigh factors differently depending on their available budget, making it important to understand how decision criteria vary rather than assuming a uniform set of motivations drives all holiday purchases.
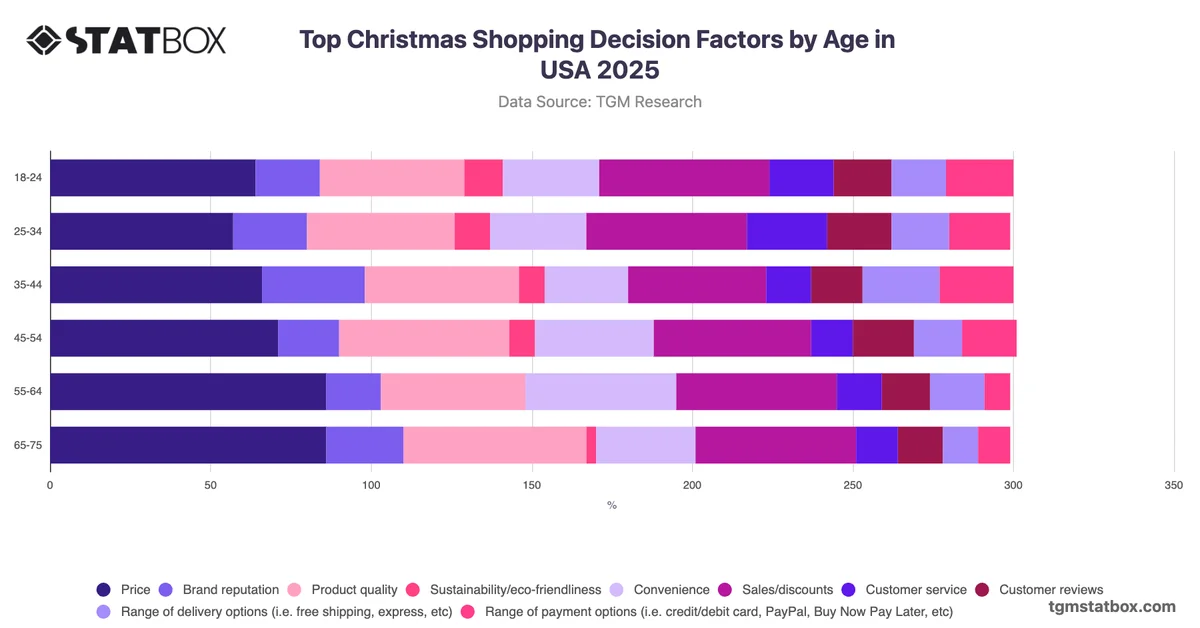
The most analytically significant pattern is the inverse relationship between spending level and price sensitivity. Among the lowest-budget shoppers (under $99), price is cited by 78%, compared with 61% among those spending $1,000 or more, a gap that points to meaningfully different decision frameworks rather than simply different budgets. Higher-spending groups, by contrast, place considerably greater weight on product quality, with $500–$999 spenders reaching 59% versus just 31% among the lowest tier. Delivery options also stand out as a differentiator: $1,000+ spenders prioritise range of delivery options at 35%, more than double the rate seen among $100–$249 spenders at 14%. This suggests that retailers targeting higher-spending segments should prioritise quality signalling and flexible fulfilment options in their communications, while value-oriented messaging and promotional pricing remain central levers for budget-conscious shoppers.