Insights library
Explore a wide range of consumer insights and statistics across industries. Discover charts on behaviors, preferences, attitudes, and market trends to find the data most relevant to your research and decision-making.
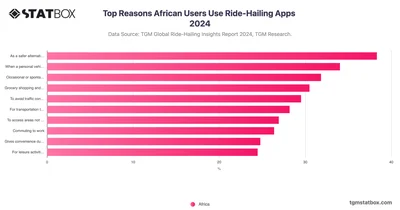
38.32% of African respondents use ride-hailing as a safer alternative, particularly when going out for events or gatherings, especially at night.
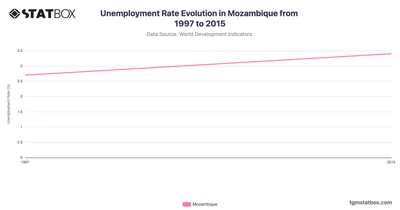
Mozambique has maintained a relatively low unemployment rate, starting at 2.7% in 1997. Discover more about Mozambique’s unemployment rate over decades on TGM StatBox.
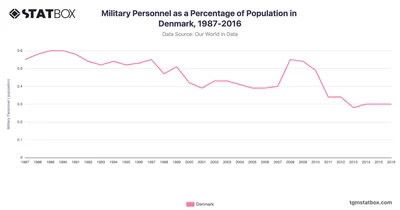
Denmark’s military personnel as a percentage of the population remained relatively stable. Discover data on Denmark’s military personnel share on TGM StatBox.
 Pro
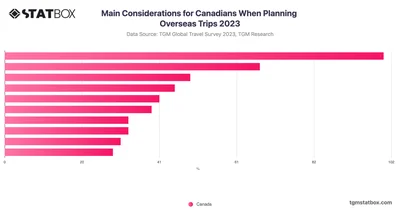
Cost emerges as the primary concern for Canadian travelers, with 49% prioritizing affordability when planning their international trips.
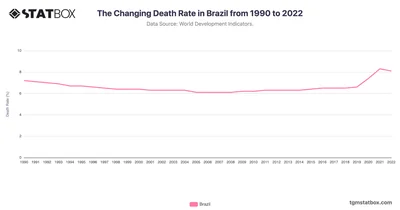
Brazil's death rate evolution highlights public health progress and ongoing challenges. Discover more statistics and insights on TGM StatBox.
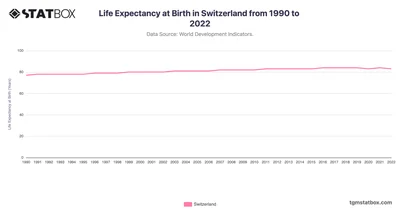
Switzerland’s life expectancy grew from 77 in 1990 to 83 in 2022, reflecting sustained healthcare excellence. Discover more statistics and insights on TGM StatBox.
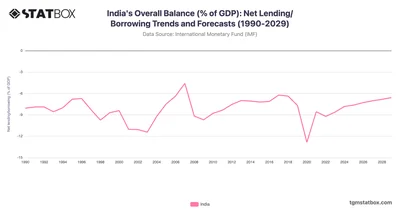
India’s deficits reflect public investments, with gradual narrowing expected despite economic challenges. Discover more statistics and insights on TGM StatBox.
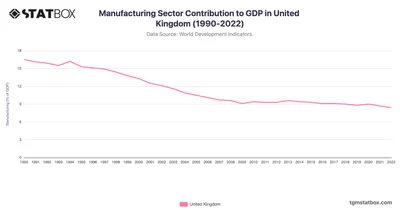
In the UK, manufacturing's GDP share began at 16.5% in 1990 but saw a steady decline through the 1990s, impacted by a focus on services, particularly finance.
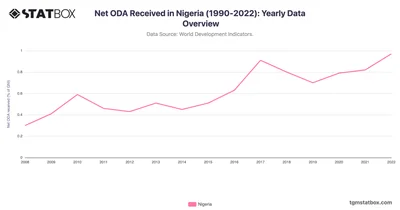
Nigeria’s Net ODA rose from 0.3% in 2008 to 1% in 2022, reflecting targeted donor programs. Discover more statistics on TGM StatBox.
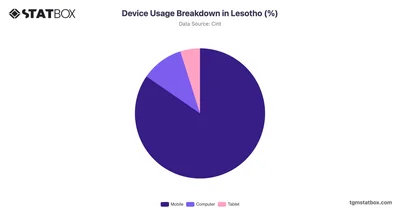
Lesotho exhibits a remarkable preference for mobile devices, with 84.62% of users relying on them. Discover more about device usage breakdown in Lesotho, on TGM StatBox.
 Pro
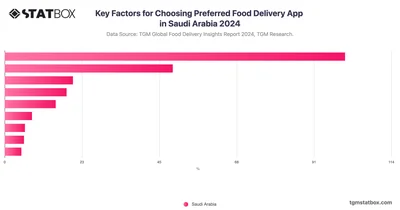
In Saudi Arabia, brand trust is the top factor in choosing food delivery apps, followed by fast order processing and a user-friendly interface for a seamless experience.
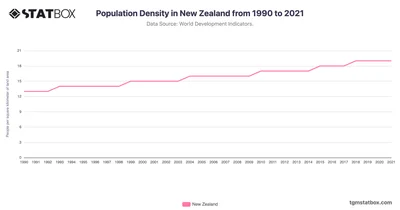
New Zealand's population density has remained relatively low, increasing from 13 people per square kilometer in 1990 to 19 in 2021. See the full data on TGM StatBox.
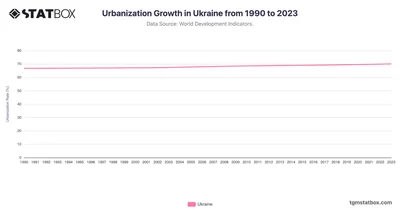
From 1990 to 2023, Ukraine’s urbanization rate grew gradually from 66.8% to 70.1%, showing a slow yet steady increase. Discover the complete data on TGM StatBox.
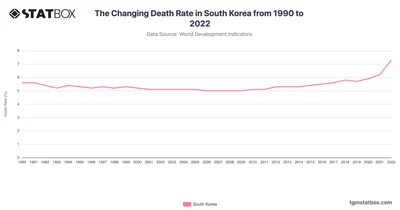
South Korea’s death rate trends reflect demographic shifts and public health initiatives. Discover more statistics and insights on TGM StatBox.
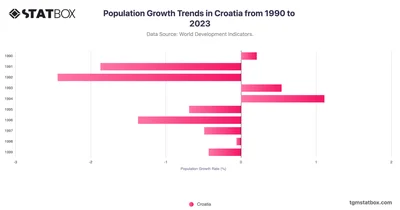
Dive into Croatia's population trends, shaped by migration and aging. Discover more statistics and insights in your target country on TGM StatBox.
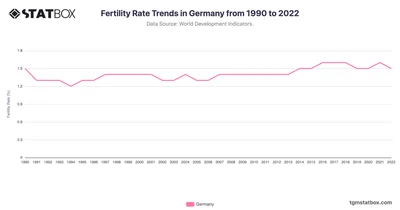
Explore Germany's fertility rates from 1990 to 2022, reflecting demographic shifts in Europe’s largest economy. Discover more statistics and insights on TGM StatBox.
 Pro
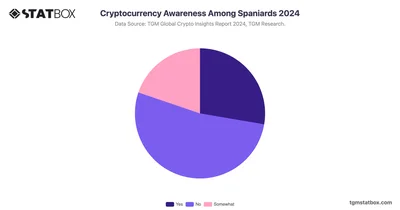
With roughly 27.7% of Spaniards being familiar with it, a large majority remains either unfamiliar or only partially familiar.
 Pro
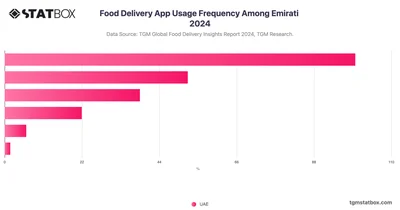
In the UAE, food delivery apps are part of daily life—69% order weekly and 10% daily, showing strong engagement in a fast-paced, convenience-driven market.
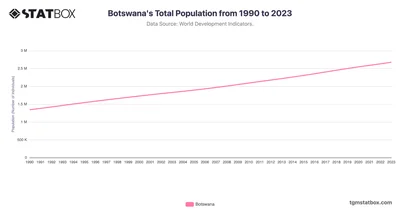
Botswana's population grew to approximately 2.67 million in 2023. Learn more about Botswana's population changes over the decades on TGM StatBox.
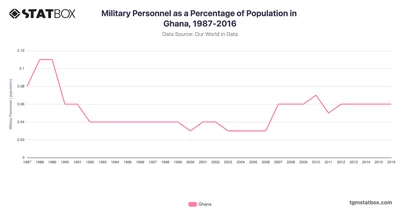
Ghana’s military personnel as a percentage of the population has shown a predominantly low and stable pattern from 1987-2016. Check full data of Ghana on TGM StatBox.
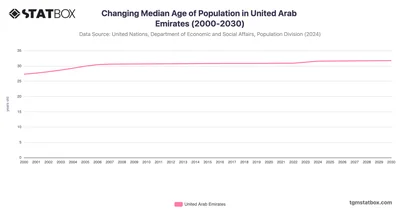
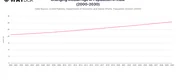
The UAE saw its median age rise moderately from 27.3 years in 2000 to an estimated 31.8 years by 2030. Discover more about median age in the UAE on TGM StatBox.
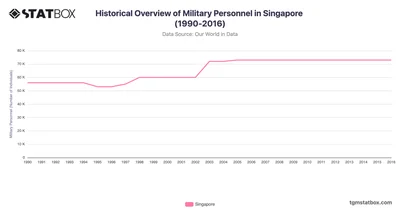
Singapore's military personnel exhibited steady growth and modernization, reflecting its strategic emphasis on national security. Discover more on TGM StatBox.
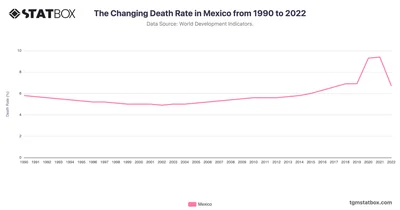
Mexico’s death rate trends reveal healthcare progress and demographic transitions. Discover more statistics and insights on TGM StatBox.
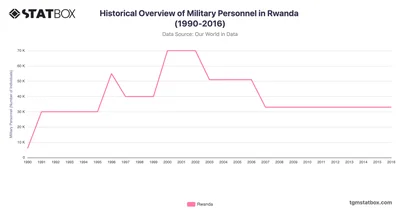
Rwanda experienced significant changes in its military personnel between 1990 and 2016, closely linked to historical events. Discover more on TGM StatBox.
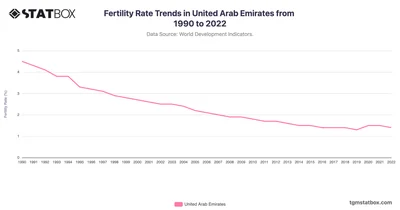
Track UAE's fertility patterns from 1990 to 2022, highlighting unique demographic transitions in the region. Discover more statistics and insights on TGM StatBox.
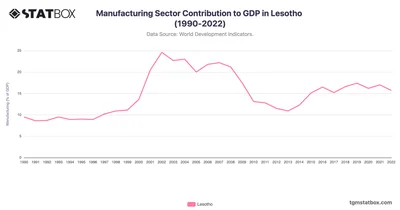
Lesotho’s manufacturing sector saw significant growth, peaking at 24.6% in 2002 due to the rise of textile exports. See more Lesotho’s GDP data on TGM StatBox.
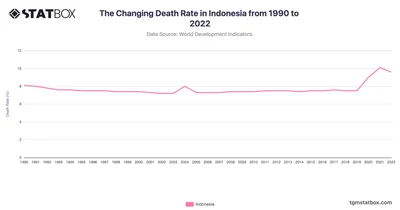
Indonesia’s declining death rate reflects strides in healthcare and persistent health issues. Discover more statistics and insights on TGM StatBox.
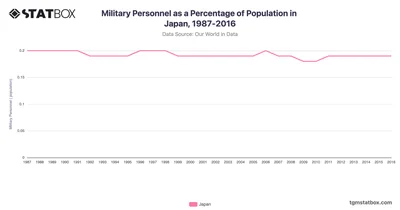
Japan’s military personnel percentage remained stable at 0.2% from 1987 to 2016. Discover data on Japan’s military personnel share on TGM StatBox.
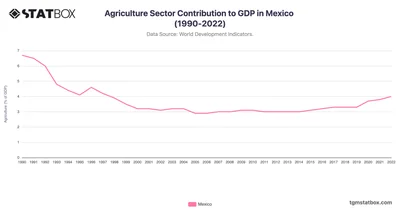
Mexico’s agriculture sector contribution to GDP declined from 6.7% in 1990 to 3.2% by 2000. Discover the full Mexico’s agriculture GDP data at TGM StatBox.
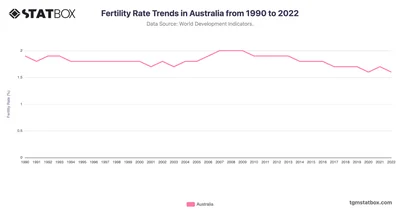
Examine Australia's fertility rate trends from 1990 to 2022, shaped by shifting social and economic factors. Discover more statistics and insights on TGM StatBox.