Inflation across developing East Asia and Pacific fell from 5.9% in 2023 to 2.2% in 2024 and 2.1% in 2025. But what happened on the consumer side? Did purchasing confidence and spending recover at the same pace?
Inflation alone cannot answer that. If you work in market research, pricing, strategy, or commercial planning, the headline rate gives you the macro context, while a deeper dive into consumer data helps you better understand what that context means for demand.
Note: In this FRED/World Bank series, “developing” refers to East Asia and Pacific economies classified by the World Bank as lower- or middle-income economies
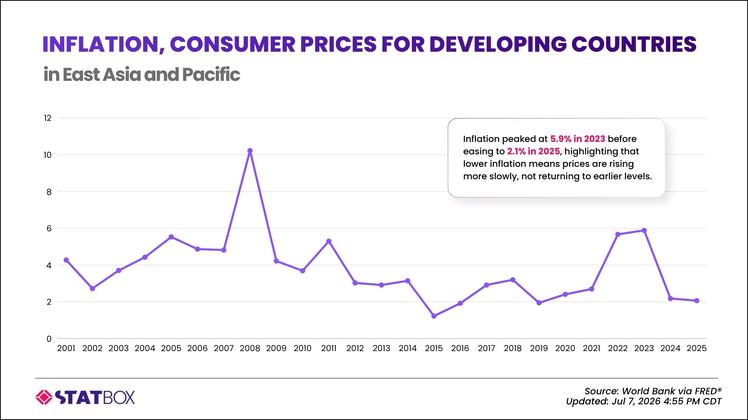
Inflation pressure increased sharply in 2022 and 2023
The 2022 inflation surge was closely tied to global food and fuel price shocks, with the impact varying widely across East Asia and Pacific.
The World Bank estimated that inflation had reduced household purchasing power by around 2% in Viet Nam and as much as 11% in Mongolia by 2022. Food and transport were major contributors to higher living costs across several economies in the region.
Some markets faced much stronger pressure than the regional figure suggests. ADB raised Lao PDR’s 2022 inflation forecast to 17% as higher oil prices and a weaker kip pushed up domestic costs. In the Philippines, the inflation forecast increased to 5.3% amid high global commodity prices and weaker domestic agricultural supply. Mongolia responded to rising inflation by increasing its policy rate by 400 basis points in the first half of 2022.
Pressure started to ease during 2023 as global commodity prices retreated. The World Bank projected energy prices to fall 26% in 2023, with Brent crude expected to average 16% below its 2022 level and coal prices falling by around 42%.
Even with those declines, the FRED regional inflation figure remained high at 5.9% in 2023. Earlier price shocks were still passing through domestic economies, while conditions differed considerably between countries.
Why did inflation fall so quickly after 2023?
By 2024–2025, lower commodity prices were feeding more clearly into consumer inflation, while domestic supply and policy actions pushed inflation down further in several markets.
ADB’s September 2025 outlook shows how different those forces looked across Southeast Asia:
China followed a different path. ADB forecast zero consumer price inflation in 2025, with lower food and oil prices and weak domestic demand keeping price pressure subdued. The same outlook also pointed to ample pork supply and intense price competition in manufactured goods, including electric vehicles.
The regional FRED figure fell to 2.1% in 2025. The decline therefore reflects a broader easing in inflation pressure rather than one single regional event. Lower commodity prices formed part of the picture, while harvest conditions and national policy responses created very different inflation outcomes across individual economies.
However, lower inflation does not mean prices returned to where they started
Here is one inflation concept that is easy to misread.
Inflation measures how quickly prices are changing. A lower inflation rate does not mean the overall price level has gone back down.
The World Bank measures consumer inflation by tracking how the cost of a typical basket of goods and services changes from one year to the next.
A simple example makes the difference clearer. Imagine a basket of everyday goods costs 100. If prices rise by 5.9%, the same basket costs about 105.9. If inflation later slows to 2.1%, prices are still increasing: the basket rises again to about 108.1. The increase is smaller, yet the price level remains well above where it started.
So the decline from 5.9% in 2023 to 2.1% in 2025 tells us something meaningful: prices were rising much more slowly. It does not tell us that households were once again paying the prices they faced before the inflation surge.
That distinction becomes especially useful when we move from inflation statistics to questions about affordability.
What happened to consumer spending as inflation eased?
Consumer spending continued to grow as inflation eased, although the pace remained uneven. The World Bank found that consumption was still supporting regional growth, while retail sales growth in China and most ASEAN-5 economies remained below their pre-pandemic trend.
A few country examples show the difference more clearly:
So consumers did not stop spending as inflation eased. They kept spending, although lower inflation did not translate into a strong, broad-based spending rebound. Income conditions and household finances continued to influence how confidently consumers spent.
What does this mean for businesses?
A 2.1% inflation rate tells you that prices are rising more slowly. It does not tell you how affordable your category feels or how willing consumers are to spend within it.
A business looking at this macro trend still needs consumer data to understand how people evaluate prices, which expenses receive priority and how purchasing behavior differs across markets. A regional inflation number gives useful context for that research. It does not replace it.
From a research perspective, that is probably the most useful way to read the chart: start with the macro signal, then test what it means at consumer level instead of assuming the answer. Inflation gives you the economic context; consumer insights show how people are responding inside that context.
TGM StatBox helps bridge those two layers, moving you from “inflation is easing” to more practical questions about what consumers are thinking and doing, using consumer statistics to read demand alongside the wider economic environment.
 Premium
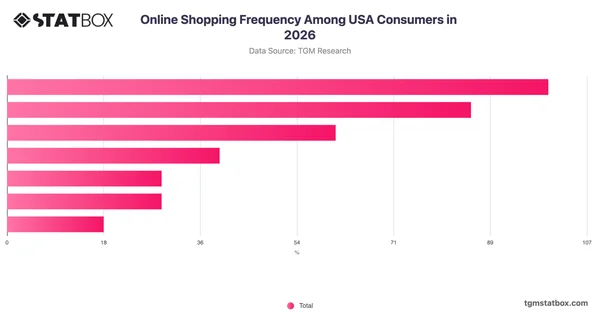
Online Shopping Frequency Among USA Consumers in 2026
Premium
Online Shopping Frequency Among USA Consumers in 2026
 Premium
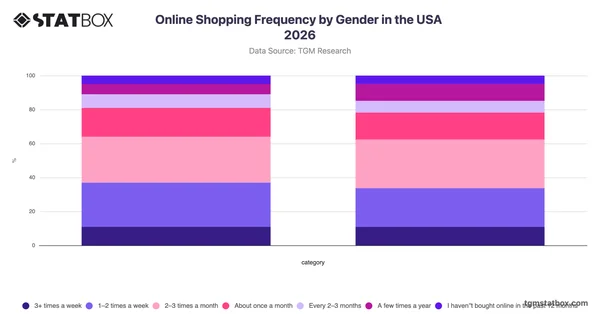
Online Shopping Frequency by Gender in the USA 2026
Premium
Online Shopping Frequency by Gender in the USA 2026
 Premium
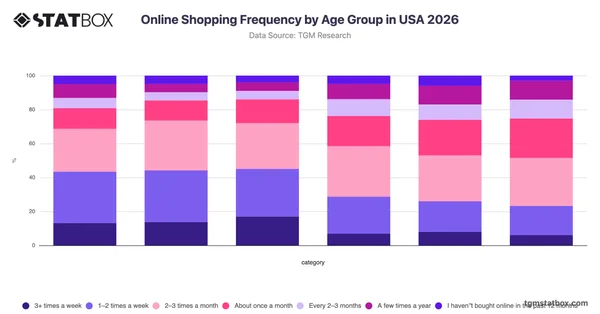
Online Shopping Frequency by Age Group in USA 2026
Premium
Online Shopping Frequency by Age Group in USA 2026
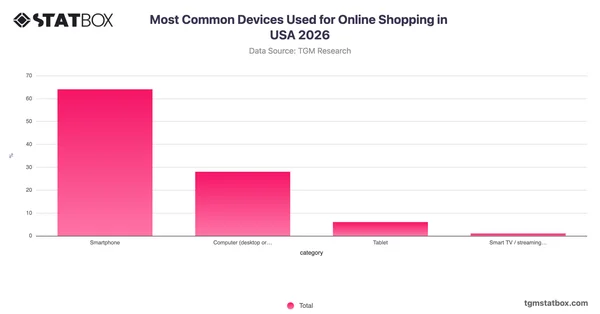 Most Common Devices Used for Online Shopping in USA 2026
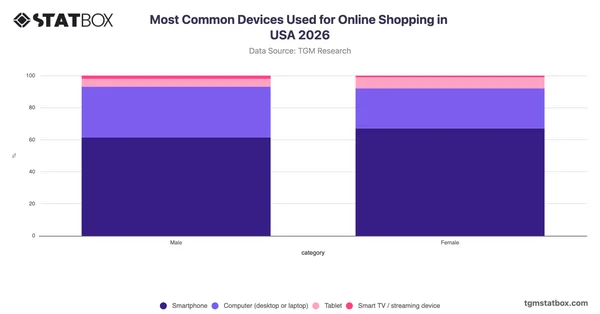 Most Common Devices Used for Online Shopping by Gender in USA 2026
 Premium
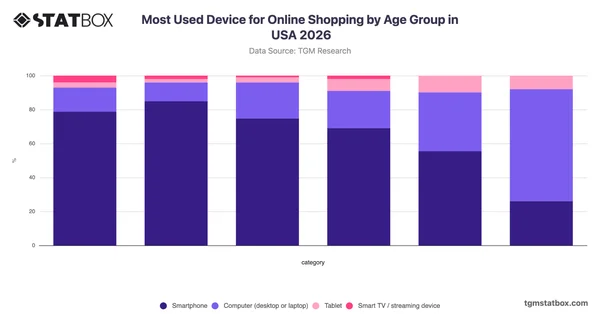
Most Used Device for Online Shopping by Age Group in USA 2026
Premium
Most Used Device for Online Shopping by Age Group in USA 2026
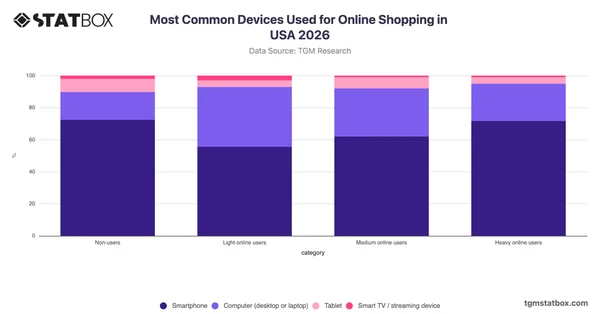 Most Common Devices Used for Online Shopping by Shopper Type in USA 2026
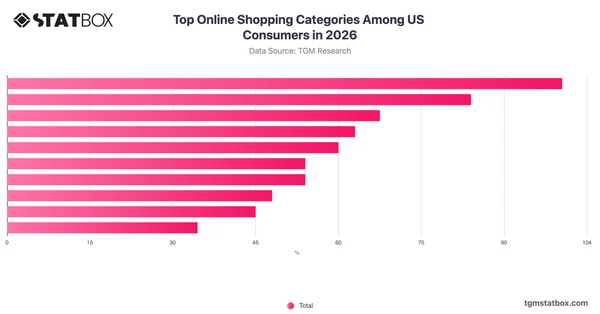 Premium
Top Online Shopping Categories Among US Consumers in 2026
Premium
Top Online Shopping Categories Among US Consumers in 2026
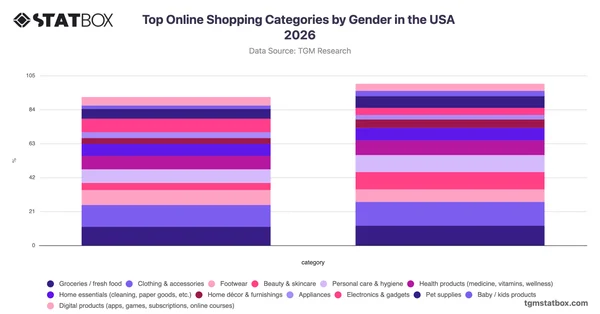 Premium
Top Online Shopping Categories by Gender in the USA 2026
Premium
Top Online Shopping Categories by Gender in the USA 2026
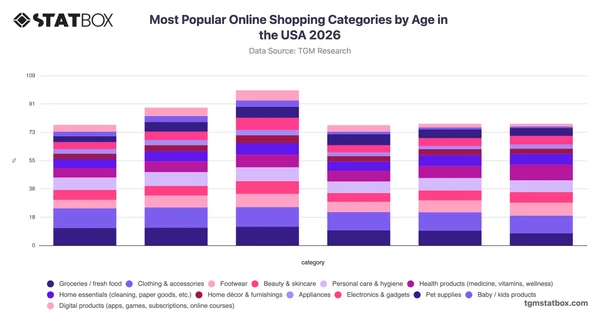 Premium
Most Popular Online Shopping Categories by Age in the USA 2026
Premium
Most Popular Online Shopping Categories by Age in the USA 2026
Disclaimer:
The inflation data in this article comes from the World Bank’s World Development Indicators and is published through FRED. Supporting economic and consumer context is drawn from official sources, including the World Bank, ADB, IMF, and national statistics agencies. The analysis summarizes published evidence and does not present subjective opinion as a data finding.
Regional inflation figures aggregate available country data and do not represent identical conditions across every economy or household. Inflation trends also differ by market, while data availability and country classifications change over time.
Regional inflation shows the overall pace of price increases. It does not directly show how consumers in each market perceive prices or how their spending behavior is changing. Consumer implications discussed in this article are therefore supported with separate country-level and consumer-related evidence where available.
The chart uses annual consumer price inflation data from the World Bank’s World Development Indicators via FRED. Labels and annotations on the chart highlight visible movements in the published data and provide descriptive context; they are not presented as formal causal or statistical analysis. The regional series does not represent the exact inflation experience of every country or household, and consumer behavior is not directly measured by this dataset.
References
Federal Reserve Bank of St. Louis (FRED) / World Bank. Inflation, Consumer Prices for Developing Countries in East Asia and Pacific. Main dataset used for annual regional inflation figures from 2021 to 2025.
World Bank. (2022). Reforms for Recovery: East Asia and Pacific Economic Update, October 2022. Used for the impact of rising food and fuel prices on purchasing power across the region.
Asian Development Bank. (2022). Asian Development Outlook 2022 Update. Used for country-level inflation conditions in Lao PDR, the Philippines and Mongolia during the 2022 inflation surge.
World Bank. (2023). Commodity Prices to Register Sharpest Drop Since the Pandemic. Used for the decline in global energy, Brent crude and coal prices during 2023.
World Bank. World Development Indicators: Inflation, Consumer Prices (Annual %). Used for the CPI definition and aggregation methodology.
Asian Development Bank. (2025). Asian Development Outlook September 2025: Growth Slows as a New Global Trade Environment Takes Shape. Used for 2025 inflation developments across China and Southeast Asian economies, including Indonesia, the Philippines, Thailand, Viet Nam, Lao PDR and Myanmar.
World Bank. (2025). A Longer View: East Asia and Pacific Economic Update, April 2025. Used for regional consumption, retail sales and consumer-confidence context as inflation eased.
National Statistics Office of Viet Nam. (2026). Socio-economic Situation in the Fourth Quarter and 2025. Used for Viet Nam’s 2025 retail sales and inflation-adjusted retail growth.
National Bureau of Statistics of China. (2026). National Economy Pushed Forward with Innovation-led and High-quality Development and Expected Targets Achieved Successfully in 2025. Used for China’s 2025 total and online retail sales growth.
Philippine Statistics Authority. (2026). Q4 2025 Household Final Consumption Expenditure. Used for full-year and Q4 household consumption growth in the Philippines.
According to World Bank data published through FRED, this chart shows how annual consumer price inflation changed across developing East Asia and Pacific from 2021 to 2025.
Findings from our data, highlighting consumer behaviour, preferences, and market signals across global markets.
Follow global economic trends and market signals through clear visual stories.
The latest launches and updates from TGM StatBox.
TGM StatBox's data and infographics across global markets.
Consumer insights, data stories and product updates as we publish them. No other mail, and one click to leave.
Roughly two emails a month.
Our team can run the study behind the story — in 60+ countries, on your question, with the data belonging to you.
Type at least two characters to search.