Over more than six decades, the U.S. and U.K. have experienced very different inflation paths. World Bank data show the clearest contrast during the 1970s and early 1980s. U.K. inflation reached about 24.2% in 1975, while the U.S. inflation recorded a lower peak of about 13.5% in 1980. The U.K. also experienced larger year-to-year movements across several periods, giving its historical inflation path a visibly wider range than the U.S. series.
The difference became much smaller during the inflation surge of the early 2020s. Annual inflation reached 8.0% in the U.S. and 7.9% in the U.K. in 2022. The paths then separated again, with U.K. inflation remaining higher in 2023 and ending 2024 at 3.3%, compared with 2.9% in the U.S.
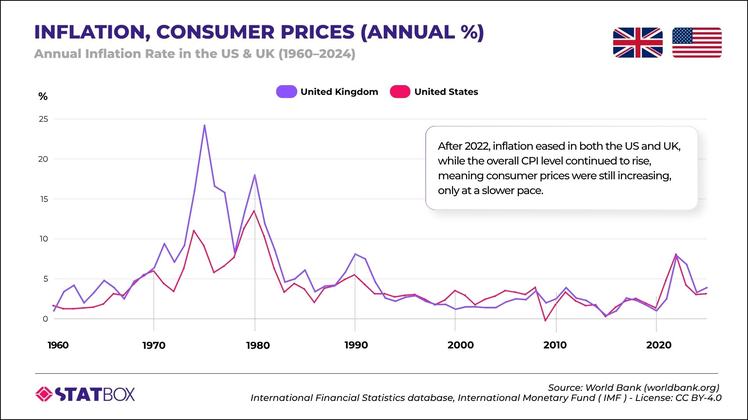
The more useful takeaway is therefore broader than identifying which market recorded the larger historical swings. The chart shows that the pricing environment surrounding a market changes over time, and the two countries do not always move through those periods in the same way. Historical differences also do not predict which country will face the stronger inflation pressure in the next cycle.
For a business, inflation data helps show how the overall price environment is changing. When inflation rises, consumer prices are increasing faster, which creates a useful signal to review pricing, demand expectations and market plans. When inflation falls, price growth is slowing, although prices can still remain well above earlier levels.
If you’re running a business, macro data gives you the big picture. It tells you what is happening around your market, rather than exactly what your customers are likely to do next.
That is where you need to look deeper. National inflation does not tell you which customers feel the greatest pressure, what purchases they protect, how much price affects brand choice, or which offers still motivate a purchase. Those are the questions that matter much more when you start making real commercial decisions.
Preparing for changing inflation conditions therefore starts before a new spike appears. A business needs a clear baseline of its target consumers: what they value, how sensitive they are to price, which spending they prioritize and how they respond when their budget comes under pressure. Repeating the same consumer measures as economic conditions change then gives the business something more useful than a macro headline alone: evidence of what is actually changing among the people it serves.
In the U.S., the World Bank series shows inflation easing more quickly after the 2022 surge and reaching 2.9% in 2024. That does not establish that U.S. consumers returned to their earlier purchasing patterns. A business selling there still needs to understand the price ranges its target customers accept, how much promotions influence choice, which categories retain spending priority and where purchase frequency changes.
In the U.K., inflation remained higher than in the U.S. through 2023 and 2024, following a history that also includes larger inflation swings in several earlier periods. Those macro patterns do not prove that U.K. consumers are more price sensitive. Instead, they make it important to test how target customers currently define value, which spending they protect, when they trade down and what makes an offer worth paying for.
Macro data therefore tells you when the economic environment deserves attention. Consumer insight tells you what that environment means for the customers your business depends on. Connecting the two gives you a more practical way to prepare for changing price conditions instead of reacting only after commercial performance begins to move.
If you sell online in the U.S. or U.K., explore TGM E-commerce Insights 2026 to compare what shoppers buy and what drives their purchase decisions.
 Premium
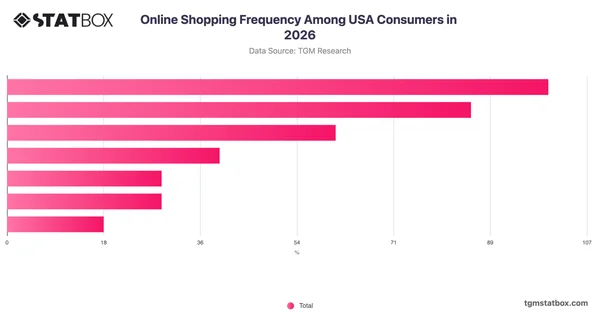
Online Shopping Frequency Among USA Consumers in 2026
Premium
Online Shopping Frequency Among USA Consumers in 2026
 Premium
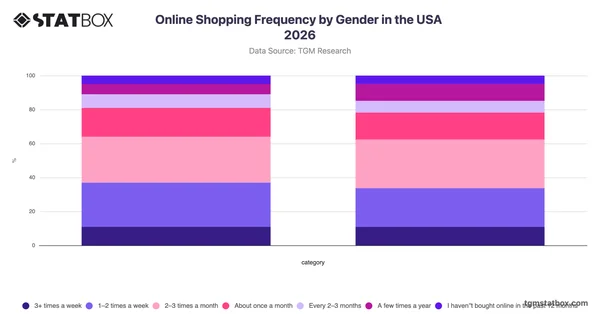
Online Shopping Frequency by Gender in the USA 2026
Premium
Online Shopping Frequency by Gender in the USA 2026
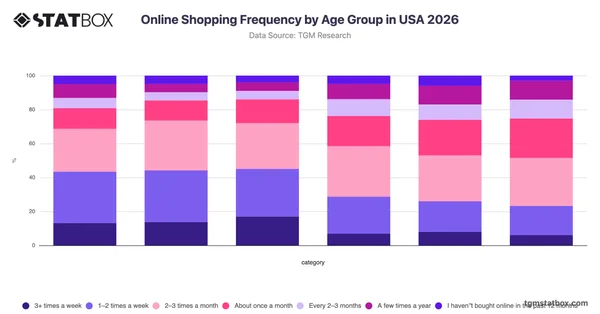 Premium
Online Shopping Frequency by Age Group in USA 2026
Premium
Online Shopping Frequency by Age Group in USA 2026
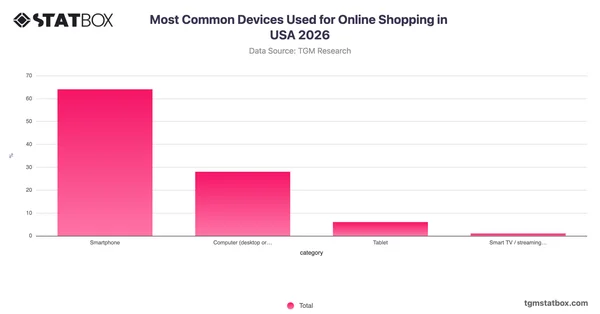 Most Common Devices Used for Online Shopping in USA 2026
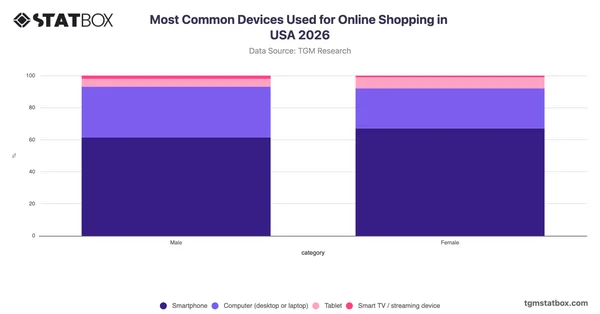 Most Common Devices Used for Online Shopping by Gender in USA 2026
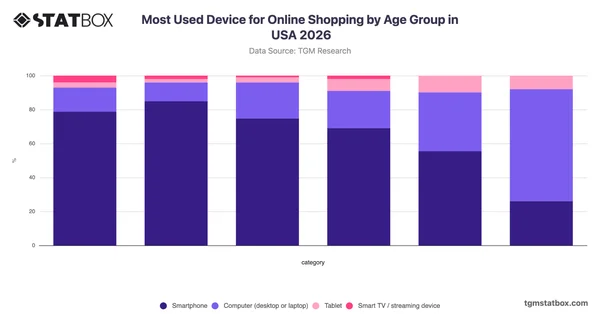 Premium
Most Used Device for Online Shopping by Age Group in USA 2026
Premium
Most Used Device for Online Shopping by Age Group in USA 2026
Note: The chart uses annual consumer price inflation data from the World Bank’s World Development Indicators. “Price swings” refers to visible changes in annual inflation rates across the period and is not presented as a formal volatility statistic. Consumer behavior discussed in the article represents the next level of analysis and is not directly measured by the World Bank inflation dataset.
References
World Bank, “Inflation, consumer prices (annual %),” sourced from IMF International Financial Statistics.
World Bank. (n.d.). Consumer price index (2010 = 100) – United Kingdom [Data set]. World Development Indicators. Retrieved August 13, 2026, from https://data.worldbank.org/indicator/FP.CPI.TOTL?locations=GB
World Bank. (n.d.). Consumer price index (2010 = 100) – United States [Data set]. World Development Indicators. Retrieved August 13, 2026, from https://data.worldbank.org/indicator/FP.CPI.TOTL?locations=US
This chart compares annual consumer price inflation in the U.S. and U.K. from 1960 to 2024, highlighting historical differences and the closer inflation surge seen in the early 2020s.
Findings from our data, highlighting consumer behaviour, preferences, and market signals across global markets.
Follow global economic trends and market signals through clear visual stories.
The latest launches and updates from TGM StatBox.
TGM StatBox's data and infographics in USA.
Consumer insights, data stories and product updates as we publish them. No other mail, and one click to leave.
Roughly two emails a month.
Our team can run the study behind the story — in 60+ countries, on your question, with the data belonging to you.
Type at least two characters to search.