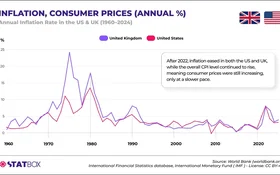
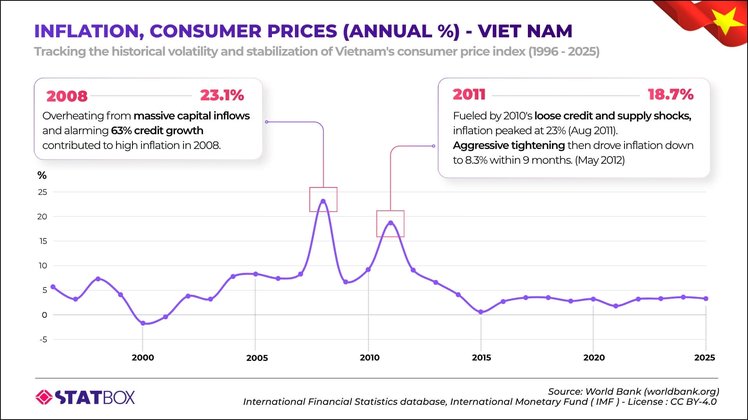
Vietnam’s inflation history shows a clear move from sharp price volatility toward a more predictable consumer environment. Annual inflation reached 23.1 percent in 2008 and averaged 18.7 percent in 2011, creating intense pressure on household budgets and business costs. Since 2016, inflation has mostly remained within a narrower 2 to 4 percent range, with the 2025 rate sitting at around 3.3 percent.
A stable inflation rate signals greater control over broad consumer price movements and gives businesses a clearer basis for pricing, budgeting, inventory planning, and contract decisions. It also reduces the risk of sudden cost shocks that force frequent price changes or weaken consumer confidence.
Price stability in Vietnam still requires close attention. Moderate inflation accumulates over time, while national figures often conceal stronger increases across food, housing, transport, healthcare, and other essential categories. Household purchasing power therefore depends on both income growth and the categories taking the largest share of monthly spending.
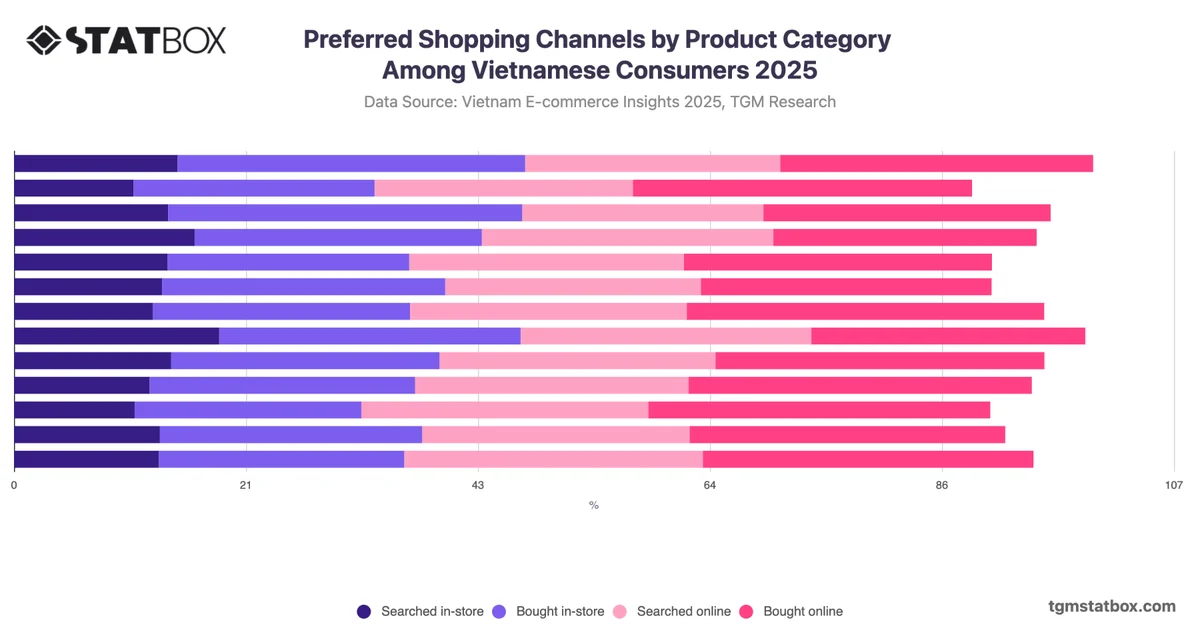
For consumer-facing businesses, Vietnam's stable headline inflation does not remove pressure at the point of purchase. As household costs rise gradually, Vietnamese consumers pay closer attention to value and adjust their choices by comparing prices, prioritising essentials, waiting for more promotions, or switching brands and pack sizes.
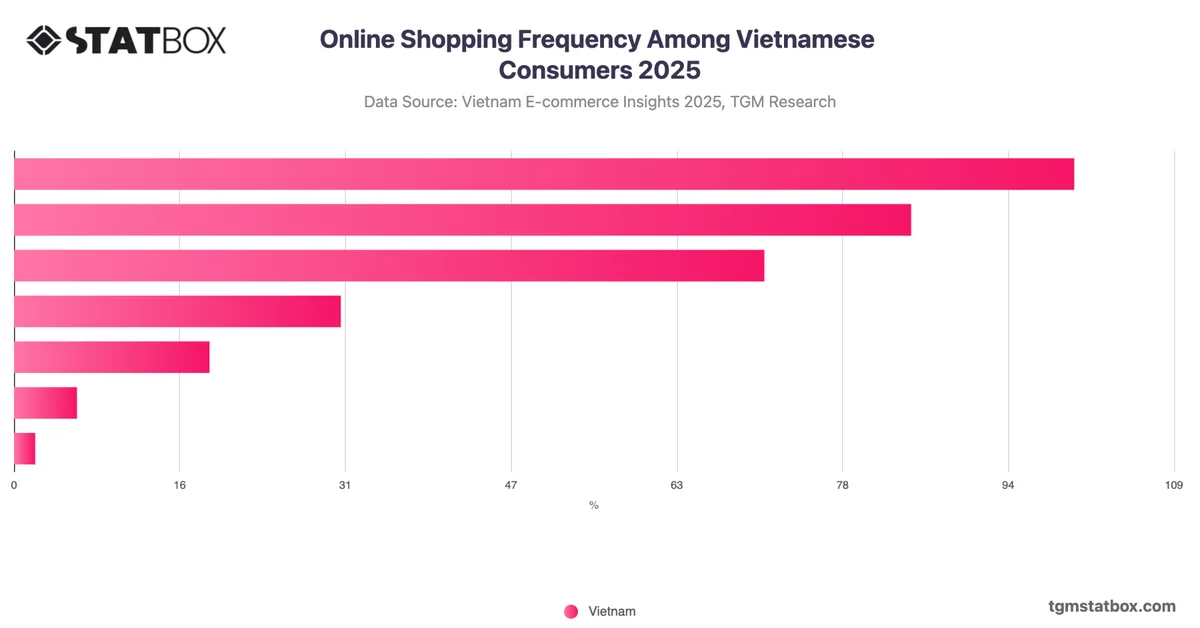
These responses appear across retail channels, while online shopping makes price-based decision-making more visible and immediate. Shoppers can compare competing offers, review the total cost after delivery fees, and move between products or sellers within minutes. Moderate price pressure therefore often shows up in both product selection and shopping channel choice.
Vietnam’s headline inflation rate provides a useful signal of overall market stability, while category-level price data and consumer research reveal how price pressure appears in everyday purchasing decisions.
If you are selling through online marketplaces in Vietnam, or planning to do so, explore StatBox’s e-commerce data to better understand online buying behavior and make stronger pricing strategies.
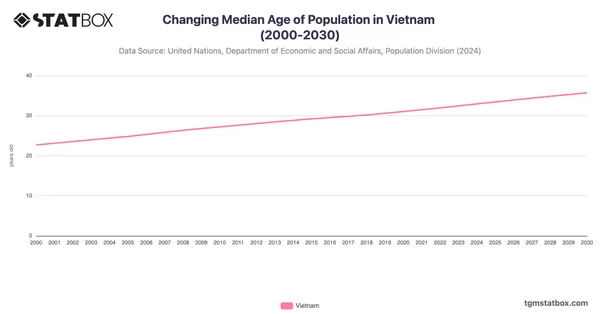 Changing Median Age of Population in Vietnam (2000-2030)
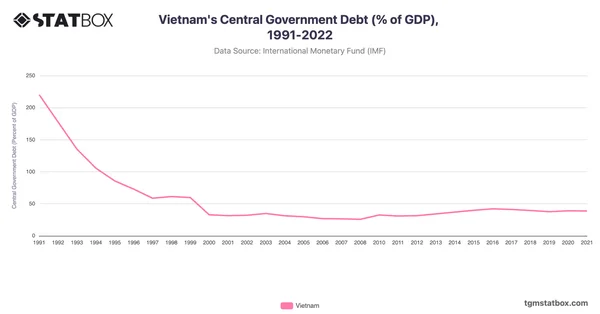 Vietnam's Central Government Debt (% of GDP), 1991-2022
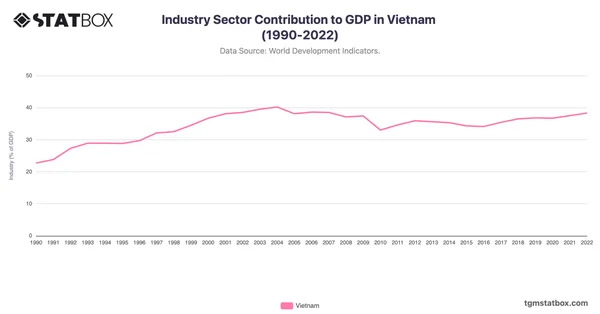 Industry Sector Contribution to GDP in Vietnam (1990-2022)
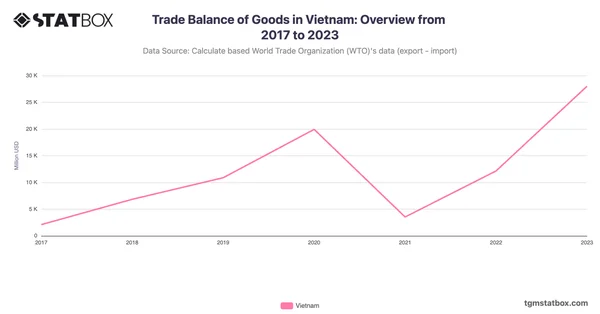 Trade Balance of Goods in Vietnam: Overview from 2017 to 2023
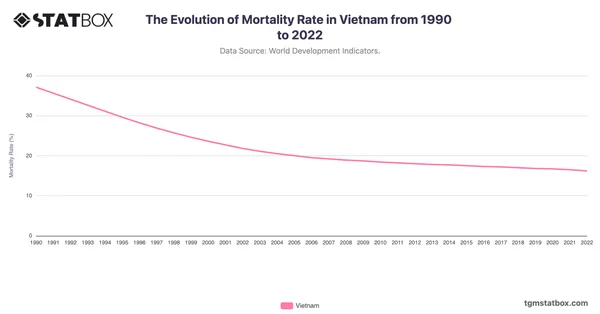 The Evolution of Mortality Rate in Vietnam from 1990 to 2022
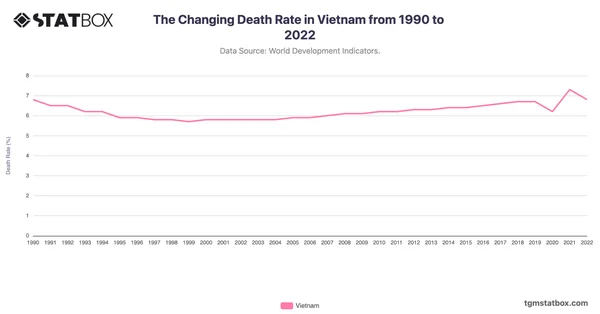 The Changing Death Rate in Vietnam from 1990 to 2022
Note: The chart reflects national-level annual inflation data from the World Bank and IMF. The analysis provides a directional analysis of its potential market and consumer implications. Actual price pressure and purchasing behavior vary by product category, income group, location, and household circumstances. References to online shopping are contextual and are not directly measured by this dataset.
References
World Bank. (n.d.). Inflation, consumer prices (annual %) – Viet Nam [Data set]. World Development Indicators. Retrieved August 13, 2026, from https://data.worldbank.org/indicator/FP.CPI.TOTL.ZG?locations=VN
World Bank. (2012, June 4). Update on Vietnam’s recent economic development: Need for careful balance between growth and inflation objectives. https://www.worldbank.org/en/news/feature/2012/06/04/update-on-vietnams-recent-economic-development-need-for-careful-balance-between-growth-and-inflation-objectives
World Bank. (2008). Taking stock: An update on Vietnam’s recent economic developments. https://documents1.worldbank.org/curated/en/383711468349805062/pdf/468520ENGLISH01tock010December02008.pdf
This chart shows how Vietnam’s annual consumer price inflation changed from 1996 to 2025.
Findings from our data, highlighting consumer behaviour, preferences, and market signals across global markets.
Follow global economic trends and market signals through clear visual stories.
The latest launches and updates from TGM StatBox.
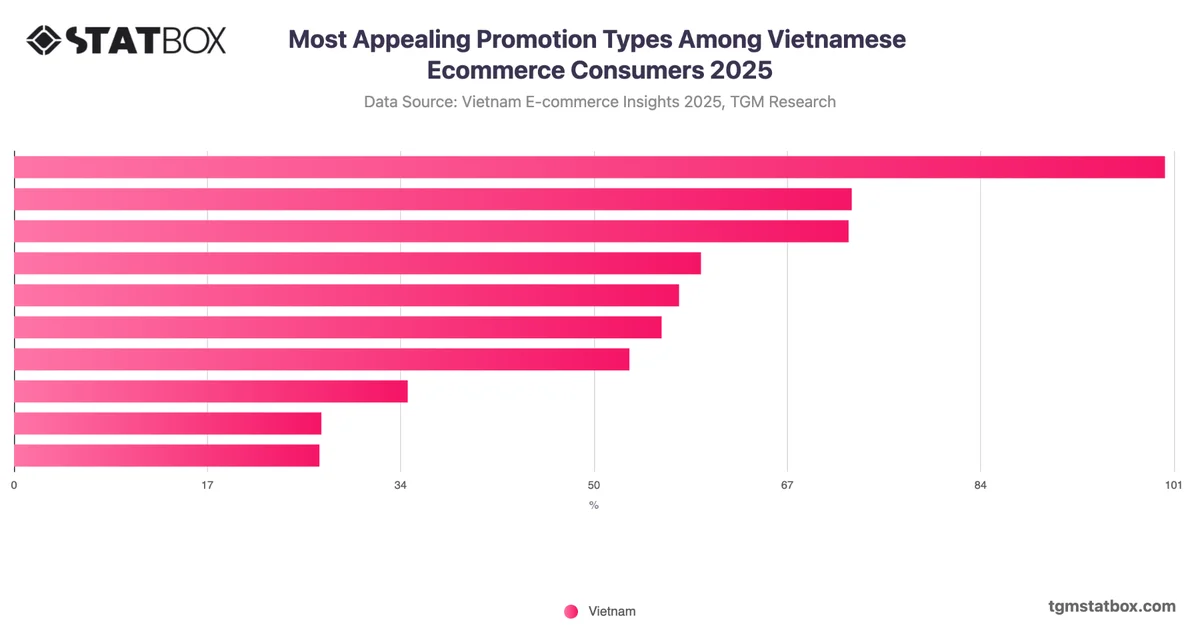
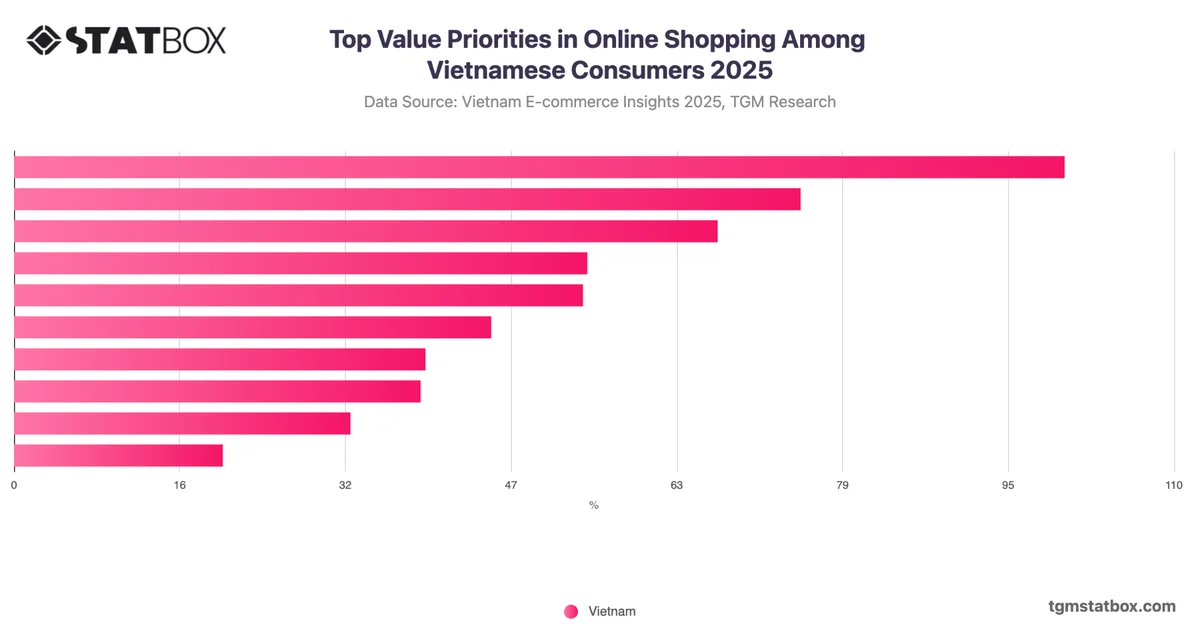
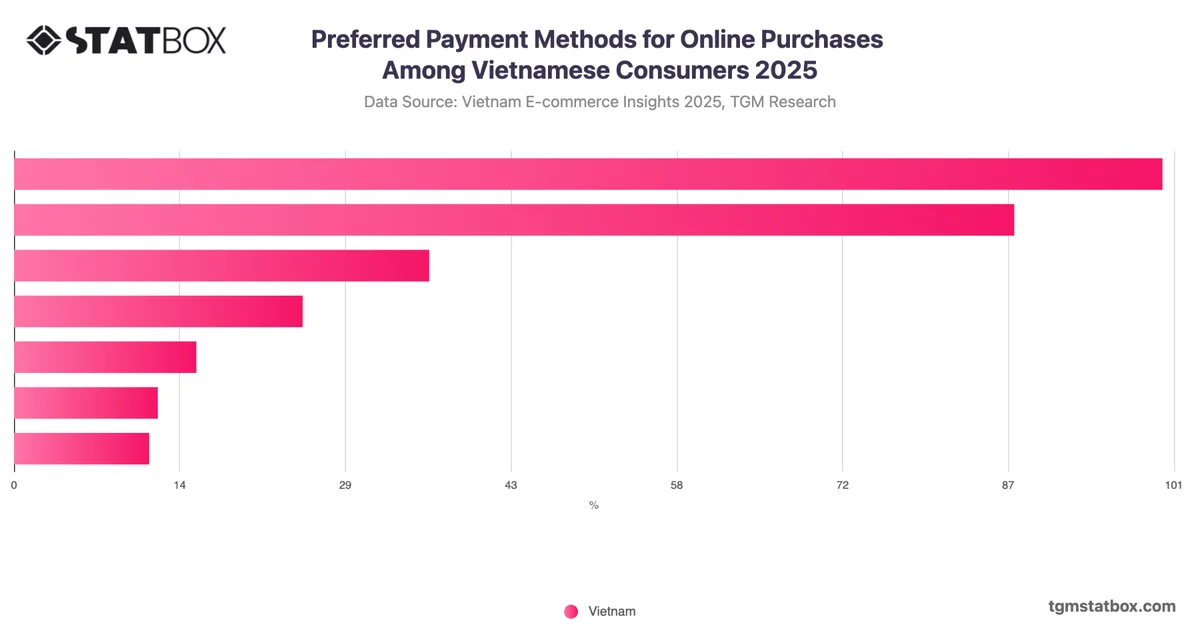
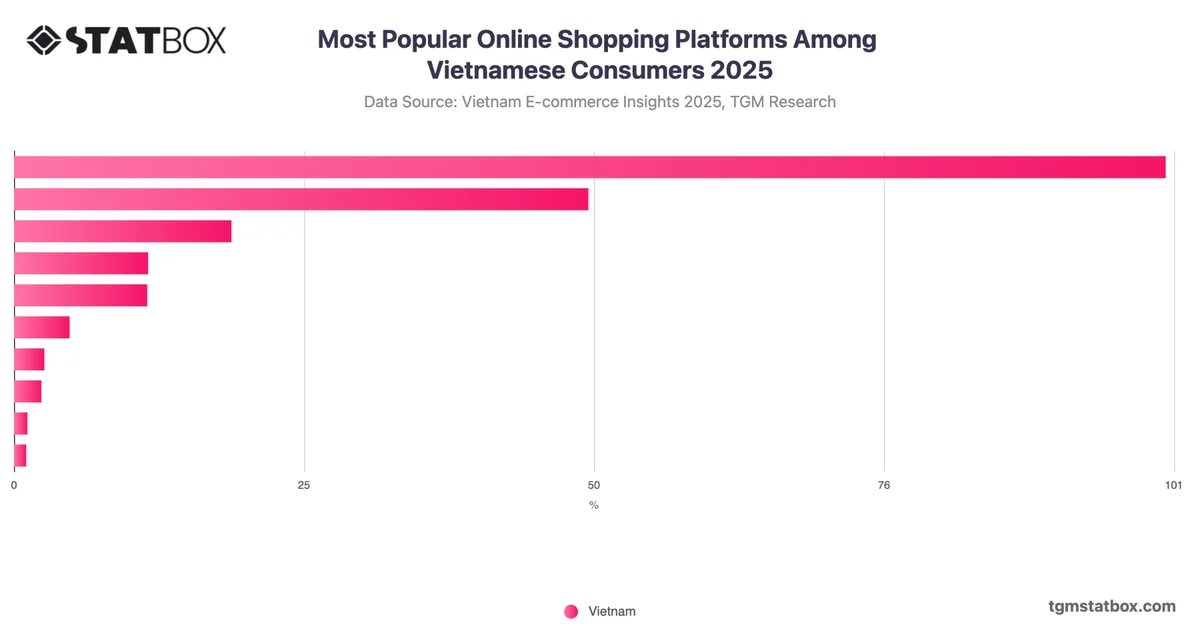
TGM StatBox's e-commerce behavior data and infographics in Vietnam.
Consumer insights, data stories and product updates as we publish them. No other mail, and one click to leave.
Roughly two emails a month.
Our team can run the study behind the story — in 60+ countries, on your question, with the data belonging to you.
Type at least two characters to search.