From AI-driven exports to domestic investment, different forces are shaping Asia's economic momentum in 2026.
According to the Asian Development Bank's September 2026 outlook, developing Asia and the Pacific is expected to grow by 5.0% in 2026, compared with 5.5% in 2025. Behind that regional figure, several economies are expanding much faster.
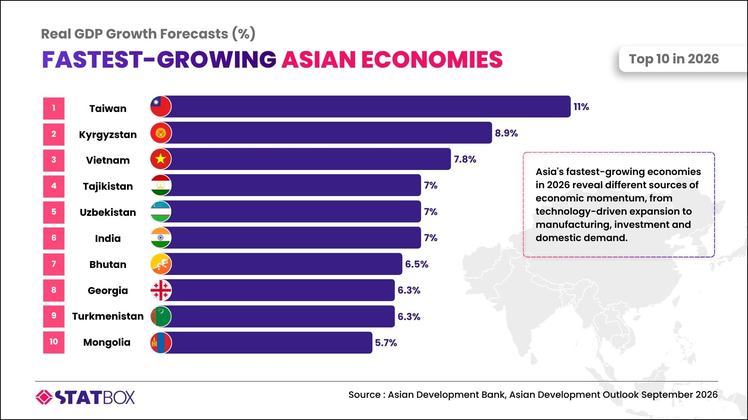
Taiwan leads a selected ranking of Asian economies with projected GDP growth of 11.0%, followed by Kyrgyzstan at 8.9% and Vietnam at 7.8%.
The ranking gives us a useful starting point. Let's look at where growth is strongest, what's driving the differences, and what these figures tell us about economic conditions beyond the headline numbers.
Which Asian economies are growing fastest in 2026?
According to the Asian Development Bank's September 2026 outlook, Taiwan, Kyrgyzstan and Vietnam top the selected 2026 ranking, while several economies across Central Asia and South Asia are also expected to record strong growth.
Taiwan stands out with growth projected at 11.0%, more than two percentage points ahead of Kyrgyzstan. Vietnam follows at 7.8%, ahead of other major Southeast Asian markets, including Indonesia (5.2%) and Malaysia (4.9%).
Central Asian economies also feature prominently. Kyrgyzstan, Tajikistan and Uzbekistan appear among the highest-growth markets, while Georgia and Turkmenistan are each projected to expand by 6.3%.
India's 7.0% growth forecast is especially notable because of its economic scale. Although several smaller economies are growing at higher percentage rates, India's much larger GDP base means that a similar percentage increase represents a substantially larger addition to total economic output.
Looking at the ranking alongside last year's figures reveals an interesting trend. Kyrgyzstan's GDP growth is expected to ease from 11.1% in 2025 to 8.9% in 2026, while Vietnam moderates slightly from 8.0% to 7.8%.
Both economies still outperform ADB's 5.0% regional growth forecast, suggesting that economic activity remains strong despite a slower pace of expansion.
The outlook also differs between the two markets. In Kyrgyzstan, ADB links the slowdown to construction and trade returning to a more normal pace, although projected inflation of 11.2% raises concerns about household purchasing power. Vietnam presents a more encouraging picture, with ADB upgrading its 2026 growth forecast from 7.2% to 7.8% following stronger-than-expected economic performance.
The direction of GDP growth matters as much as the ranking itself. Strong growth supported by investment and demand sends a different signal from rapid expansion accompanied by persistent price pressures.
What's driving economic growth across Asia?
Asia's growth comes from different sources. Some economies are benefiting from technology exports, while others rely more heavily on manufacturing, investment and domestic consumption.
Taiwan offers one of the clearest examples of technology-driven growth.
Demand for semiconductors and AI-related hardware has provided a powerful boost to the economy. According to Taiwan's Directorate-General of Budget, Accounting and Statistics, real exports of goods and services are projected to grow by 21.28% in 2026, supported by expanding global demand for AI infrastructure.
Businesses across the semiconductor supply chain are also increasing production capacity and equipment investment.
That helps explain Taiwan's exceptional GDP forecast. A large part of its economic momentum is connected to industries serving international technology demand.
Vietnam's growth story is different.
Manufacturing, exports and services continue to support economic activity, alongside domestic demand and investment.
In its September 2026 outlook, ADB identifies Vietnam as the developing Southeast Asian economy receiving the largest upward revision to its growth forecast.
The country's performance highlights the importance of production and trade activity. However, the 7.8% national growth forecast covers the economy as a whole. Individual industries still experience different demand conditions, investment cycles and operating costs.
India shows another combination of growth drivers.
ADB expects the Indian economy to grow by 7.0% in FY2026, supported by resilient consumption, healthy investment and strong services exports.
Domestic demand plays an important role in India's outlook, while service exports provide another source of economic activity.
Meanwhile, Central Asian economies illustrate how investment and local economic conditions produce different outcomes within the same broad region.
ADB reports stronger-than-expected activity in Uzbekistan and Georgia, leading to upgraded 2026 forecasts. Tajikistan, by comparison, faces disruptions to fuel imports that have weakened its near-term outlook.
Across the region, economic growth remains exposed to external pressures.
ADB forecasts inflation of 4.2% across developing Asia and the Pacific in 2026, with elevated energy prices, geopolitical tensions and the possibility of a strong El Niño affecting the outlook.
The overall picture is one of continued expansion, supported by different combinations of external demand and domestic activity. Each country's GDP figure summarizes that performance, while the underlying economic drivers explain where growth is concentrated.
Beyond GDP Growth: What Do the Numbers Mean for Industries and Consumers?
A growing economy creates a broader setting for business activity. To understand the commercial opportunities within it, we need to look at how growth reaches individual industries and households.
Start with the difference between economic output and consumer purchasing power.
Kyrgyzstan provides a useful example. ADB forecasts real GDP growth of 8.9% in 2026, while consumer price inflation is expected to reach 11.2%.
Both figures describe important economic conditions, but they measure different things.
Real GDP tracks changes in inflation-adjusted economic output. Consumer price inflation measures changes in household prices. The combination highlights why strong national growth alone provides an incomplete picture of household finances.
To understand what consumers experience, we also need information on wages, disposable income and how spending is distributed across essential and discretionary purchases.
A similar distinction matters when looking at individual industries.
Taiwan's strong economic growth is closely tied to global demand for semiconductors and AI hardware, creating momentum in its technology sector. For businesses in retail or hospitality, however, consumer spending, retail sales and tourism activity provide more relevant indicators of market demand.
Industry production, sector revenue and investment statistics help identify where economic activity is concentrated. Consumer research then brings the analysis closer to actual purchasing decisions.
Vietnam offers another example. Its 7.8% GDP growth forecast signals continued economic expansion, while category-level demand depends on consumer priorities and spending behavior.
For example:
The same principle applies to India, Indonesia and other Asian markets. Two economies with similar GDP growth rates still have different income structures, sector conditions and consumer preferences.
So, for businesses comparing markets, looking at several layers of data creates a clearer picture:
The key takeaway from Asia's 2026 growth ranking is straightforward: economic growth tells us where output is expanding, while industry and consumer data help explain what that expansion means within each market.
At TGM StatBox, you can explore market statistics and consumer insights across countries and industries, adding another layer of understanding to the broader economic picture.
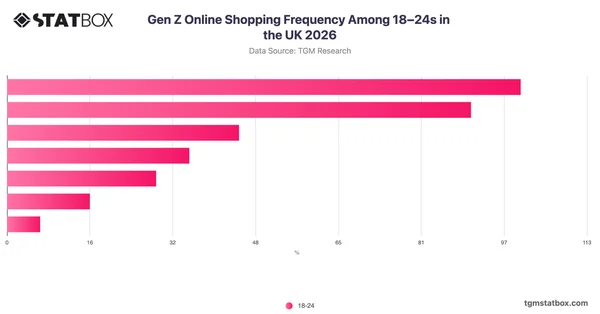
 Gen Z Online Shopping Frequency Among 18–24s in the UK 2026
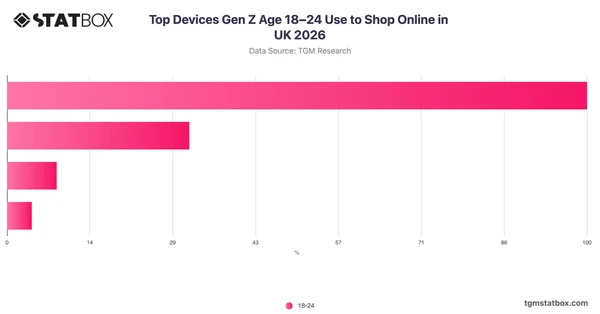 Top Devices Gen Z Age 18–24 Use to Shop Online in UK 2026
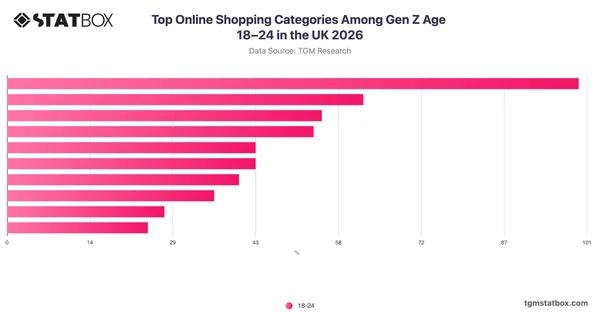 Top Online Shopping Categories Among Gen Z Age 18–24 in the UK 2026
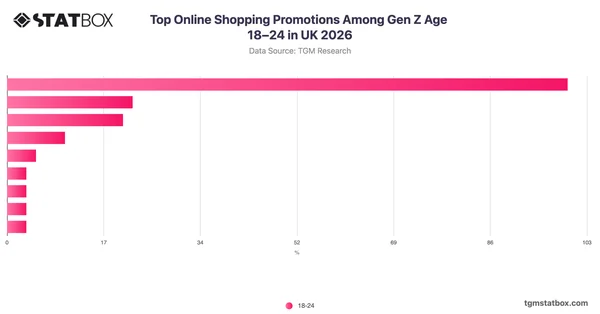 Top Online Shopping Promotions Among Gen Z Age 18–24 in UK 2026
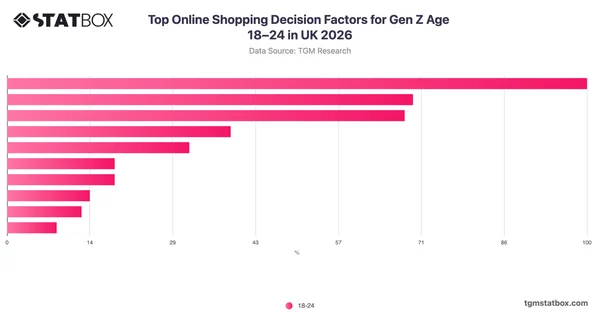 Top Online Shopping Decision Factors for Gen Z Age 18–24 in UK 2026
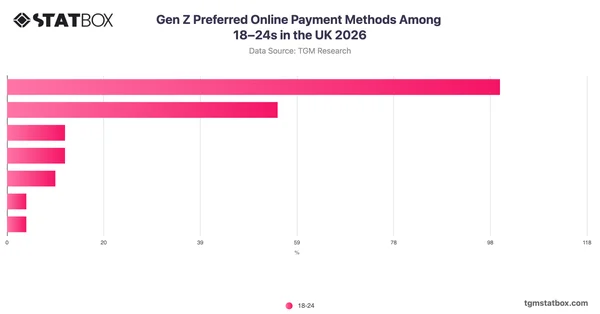 Gen Z Preferred Online Payment Methods Among 18–24s in the UK 2026
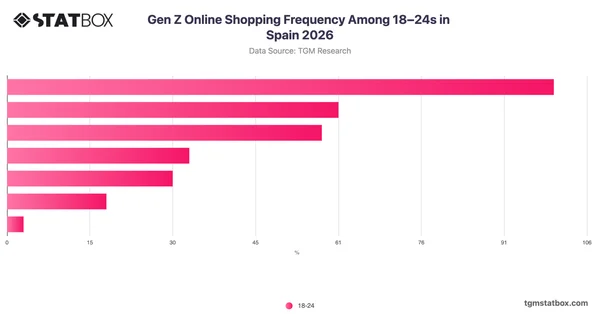 Gen Z Online Shopping Frequency Among 18–24s in Spain 2026
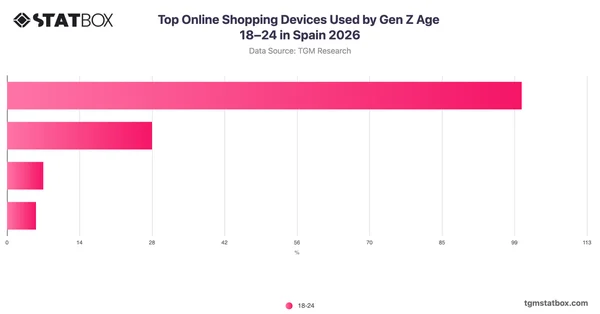 Top Online Shopping Devices Used by Gen Z Age 18–24 in Spain 2026
Note: Data source and methodology
The ranking presents selected Asian economies using real GDP growth forecasts from the Asian Development Bank's Asian Development Outlook, September 2026. The figures represent projected changes in inflation-adjusted economic output, rather than finalized full-year results.
India's 2026 forecast refers to its fiscal year ending March 2027. The ADB's 5.0% regional growth projection refers specifically to developing Asia and the Pacific and is not an average of the selected economies.
Supporting economic context comes from ADB's regional and country assessments and Taiwan's official economic statistics. GDP forecasts do not directly measure individual household purchasing power, industry profitability or consumer purchasing intentions.
Based on the Asian Development Bank's September 2026 economic outlook, this chart ranks 10 selected Asian economies by projected real GDP growth, highlighting the fastest-growing markets and differences in economic performance across Asia.
Findings from our data, highlighting consumer behaviour, preferences, and market signals across global markets.
Follow global economic trends and market signals through clear visual stories.
The latest launches and updates from TGM StatBox.
TGM StatBox's data and infographics across global markets.
Consumer insights, data stories and product updates as we publish them. No other mail, and one click to leave.
Roughly two emails a month.
Our team can run the study behind the story — in 60+ countries, on your question, with the data belonging to you.
Type at least two characters to search.