How often do Europeans shop online, and what does that reveal about their purchasing habits? Eurostat's 2025 data highlights differences in shopping frequency across European markets, from occasional buyers to frequent online shoppers.
If you work in e-commerce, understanding these patterns is valuable, and knowing how to apply them is even more important. By combining Eurostat's market statistics with TGM E-commerce Insights data on purchase drivers and payment preferences, you gain a deeper understanding of consumer behavior and stronger evidence to guide your business growth strategy.
How frequently did Europeans shop online in 2025?
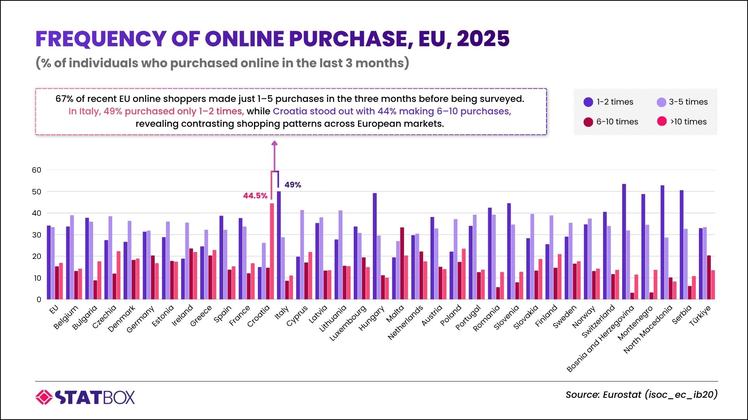
According to Eurostat's E-commerce Statistics for Individuals, 67% of recent online shoppers in the EU made no more than five purchases during the three months preceding the 2025 survey.
The distribution shows:
The finding reveals an important distinction between online shopping participation and purchasing frequency. Even among people who recently bought online, frequent purchasing is concentrated in a smaller group.
If you're assessing e-commerce opportunities, the distinction helps you avoid treating all online shoppers as equally active customers. How frequently people buy is a separate consideration from how many people shop online.
Country-level data adds another layer, revealing where occasional purchases are more common and where frequent shopping represents a larger share of online activity.
Which European countries have the most frequent online shoppers?
Eurostat's 2025 data reveals contrasting purchase frequency patterns across European markets.
Italy stands out for lower purchase frequency. Nearly half (49%) of recent online shoppers purchased only once or twice in three months, 15 percentage points above the EU average of 34%. Slovenia followed at 45%.
Meanwhile, Cyprus and Lithuania recorded the highest proportions of shoppers making 3–5 purchases, at 41% each.
Croatia and Malta show a different purchasing pattern:
Croatia and Malta were the only EU countries where a higher-frequency category represented the largest share of recent online shoppers.
The key insight is that the mix of online shopping activity differs considerably across markets. Italy has a larger concentration of people making fewer purchases, while Croatia and Malta have substantial groups purchasing much more frequently.
The distinction points to different questions for your e-commerce research.
In Italy, you need to understand what encourages shoppers to make additional purchases. In Croatia or Malta, a relevant question is which product categories account for frequent buying and how consumers choose between retailers.
Higher shopping frequency does not mean higher spending or stronger loyalty to individual brands. Eurostat measures purchases across online sellers, without identifying their value or the reasons behind them.
Understanding those missing details is essential before turning purchase frequency statistics into decisions about customer acquisition or retention.
So, why is shopping frequency important for E-commerce decisions, and is it enough?
Shopping frequency is a valuable indicator of online purchasing activity. It helps you compare consumer buying patterns across markets and identify where to investigate potential e-commerce opportunities.
Consider an online beauty retailer planning to expand into either Italy or Croatia. Eurostat shows that 49% of recent online shoppers in Italy made only 1–2 purchases, while 44% in Croatia made 6–10 purchases during the three months before their surveys.
Croatia's higher concentration of frequent shoppers offers a useful signal for further market assessment. Yet the retailer still faces problem: Does that higher shopping frequency translate into stronger demand for beauty products?
Eurostat's figures cover online purchases across all product categories. The retailer still needs to establish how often consumers buy beauty products specifically and which customer groups offer the strongest potential for repeat purchases.
Without that evidence, prioritizing Croatia over Italy or allocating a larger marketing budget based solely on overall shopping frequency remains difficult to justify.
Eurostat provides a credible foundation for identifying market differences and setting research priorities. When you move from assessing markets to planning how to attract customers and encourage purchases, consumer-level evidence becomes essential.
One practical area to explore next is how shoppers prefer to pay, and what those preferences reveal about their purchasing decisions.
How do payment preferences and consumer insights complete the E-commerce picture?
Eurostat shows how often Europeans shop online, yet purchase frequency alone leaves an important question unanswered: How do consumers prefer to pay for those purchases?
Do shoppers prefer credit cards or digital wallets? How interested are they in Buy Now, Pay Later (BNPL) options? Understanding these preferences helps you prioritize payment options that suit your customers, rather than applying the same checkout experience across different markets.
Payment choices are only one part of the picture. Knowing what consumers buy and what drives their purchase decisions is equally valuable when planning your product assortment and promotional strategy.
Consumer research adds this level of detail. Through TGM E-commerce Insights 2026, you can explore payment preferences, product categories and purchase drivers across major European markets, with comparisons between consumer groups.
Italy offers a practical connection to the Eurostat findings. While 49% of its recent online shoppers made only one or two purchases, TGM StatBox's research on Italian shopping decision factors provides another perspective by examining what different shopper segments prioritize when choosing where to buy.
Payment research adds another dimension. In Germany, TGM StatBox examines preferred online payment methods by gender, helping retailers assess how checkout preferences differ between customer groups.
The value comes from using these insights together. Eurostat identifies differences in online purchasing activity across markets, while consumer research helps you investigate the preferences behind purchase decisions. Combined with your own sales and checkout data, these insights provide a stronger foundation for localized e-commerce strategies.
Explore more e-commerce consumer insights on TGM StatBox to connect broader market trends with the customers you want to reach.
 Premium
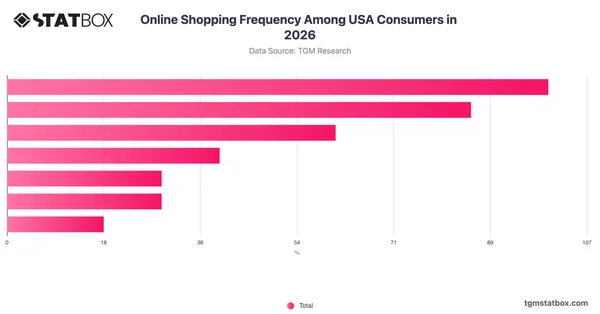
Online Shopping Frequency Among USA Consumers in 2026
 Premium
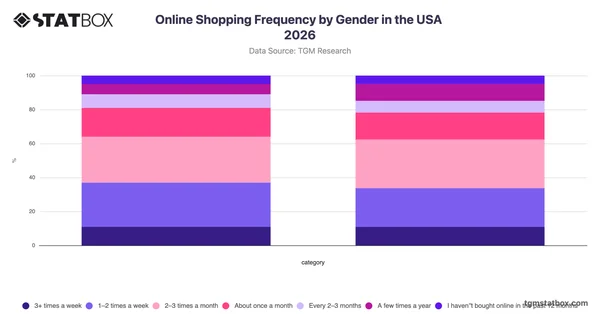
Online Shopping Frequency by Gender in the USA 2026
 Premium
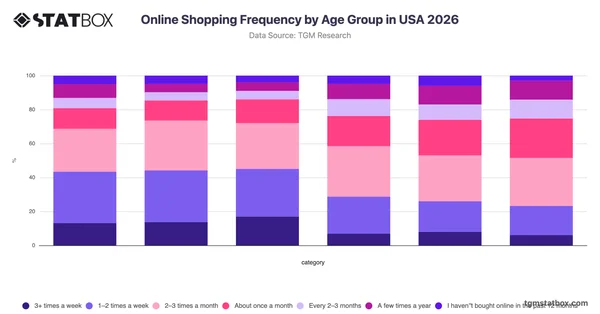
Online Shopping Frequency by Age Group in USA 2026
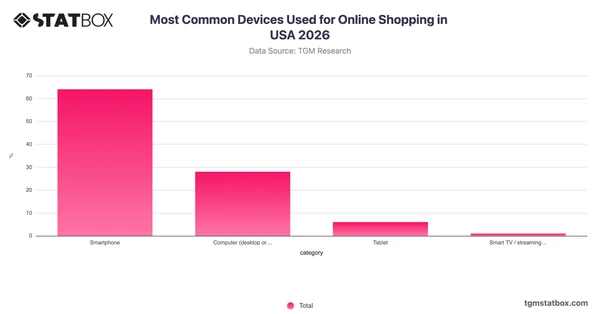 Most Common Devices Used for Online Shopping in USA 2026
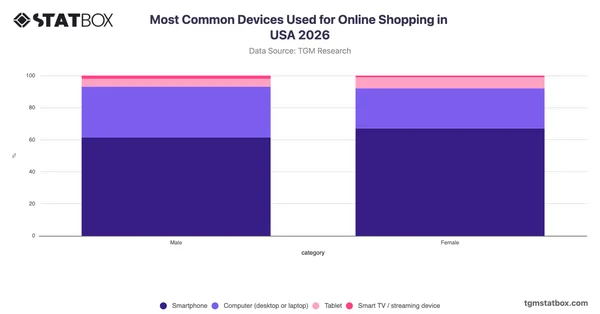 Most Common Devices Used for Online Shopping by Gender in USA 2026
 Premium
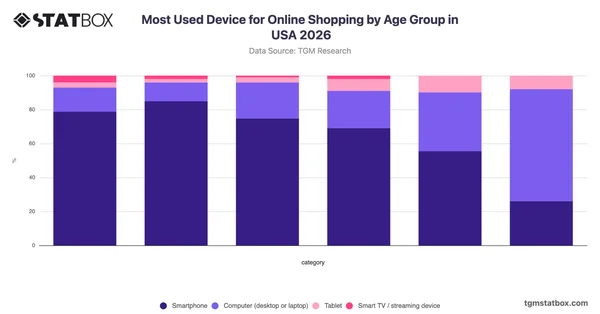
Most Used Device for Online Shopping by Age Group in USA 2026
Methodology
The TGM E-commerce Insights 2026 study is based on a large-scale quantitative survey conducted across multiple countries worldwide, designed to capture consumer shopping patterns, users frequency, and decision drivers in 2026. The study provides comparable, country-level data to support market assessment, localization, and strategic planning for e-commerce platforms, retailers and brands.
Survey Methodology: online interviews (CAWI – Computer-Assisted Web Interviewing)
Sample Size: 7,077 participants
Age Groups: 18–65+
Country Coverage: US, UK, Poland, Germany, Italy, France & Spain
Data Weighting: Results have been weighted to reflect national demographics for accurate market representation
Note: Eurostat's 2025 figures measure online purchase frequency over a three-month reference period, not the full calendar year. Survey periods vary across countries and do not represent a single calendar quarter. The Eurostat article was published in June 2026, using data extracted in February 2026.
Based on Eurostat's 2025 survey, this chart compares online purchase frequency across European countries, measured over the three months preceding each respondent's survey. It highlights differences between occasional and frequent online shoppers, offering valuable context for understanding purchasing activity and identifying opportunities for deeper consumer research.
Findings from our data, highlighting consumer behaviour, preferences, and market signals across global markets.
Follow global economic trends and market signals through clear visual stories.
The latest launches and updates from TGM StatBox.
TGM StatBox's data and infographics across global markets.
Consumer insights, data stories and product updates as we publish them. No other mail, and one click to leave.
Roughly two emails a month.
Our team can run the study behind the story — in 60+ countries, on your question, with the data belonging to you.
Type at least two characters to search.